Indicator Settings
Run the indicator on the chart, and go to the Input Parameters tab.
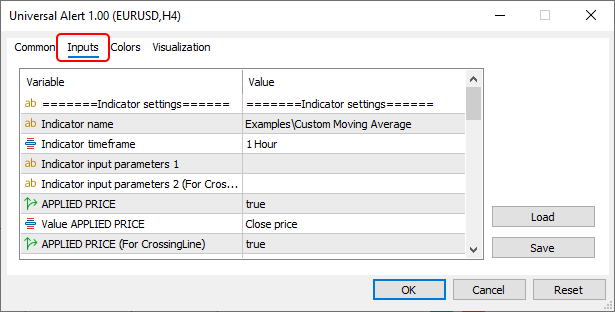
Indicator name
Enter the name of the custom indicator whose lines will be used in the signal. UniversalAlert only works with custom indicators. All built-in indicators from the Indicators\Trend, Indicators\Oscillator, Indicators\Volumes, Indicators\Bill Williams folders are available in the custom version in the Examples folder.
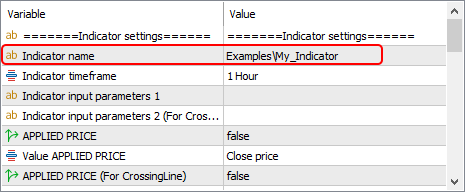
- If the custom indicator is in the MQL5\Indicators folder, just enter the indicator name in the input field, for example, My_Indicator.
- If the custom indicator is in a subfolder, for example, MQL5\Indicators/Examples, enter the subfolder and indicator name in the input field, for example, Examples\My_Indicator.
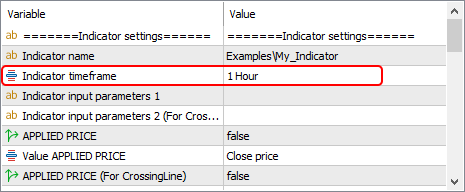
Indicator timeframe
Specify the chart timeframe on which the custom indicator will operate and where the signal search will be performed.
Indicator input parameters 1
Enter the input parameters for the custom indicator.
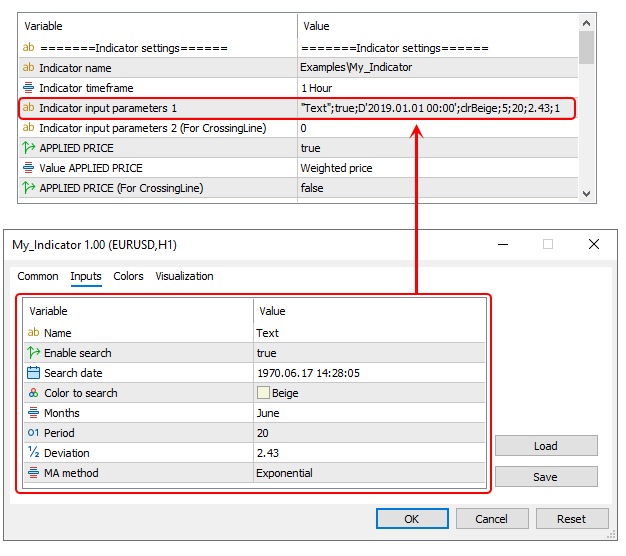
For a custom indicator, you can set your own input parameters. To do this, enter them in the Indicator input parameters 1 field following these rules:
- Enter parameters in the strict order as in the original indicator;
- Enter all parameters without exception, even if they are not significant, like color;
- If there is more than one parameter, use ; to separate each one. Do not put a separator after the last parameter;
- Do not enter spaces or any other characters that are not parameters;
Parameters are divided into types, and it's important to enter them according to the rules set for each type:
| Icon | Variable Type | Input Format |
|---|---|---|
 | int - integer | Enter as a number without any additional symbols, for example 345. |
 | double - floating-point number | Enter as a number with a dot as the decimal separator, for example 345.67. |
 | string - text string | Enter as text enclosed in quotes "", for example "text". |
 | color | Enter as a string containing the color (from the "Web Colors Set", the string should start with clr), for example, clrRed. |
 | datetime | Enter in the format D'2015.01.01 00:00' |
 | dropdown list | Enter the row number of the selected value. Numbering starts from 0 and goes from top to bottom.* |
* In rare cases, the list numbering might be in a different order, so if the data doesn’t match when checking the indicator buffer readings, you need to check that the dropdown list row number is entered correctly.
To do this, enter the necessary settings in the custom indicator and save them as a template. Then open the template in any text editor and find the line with the desired dropdown list. This line will contain the number that you need to enter into the Universal Alert parameters.
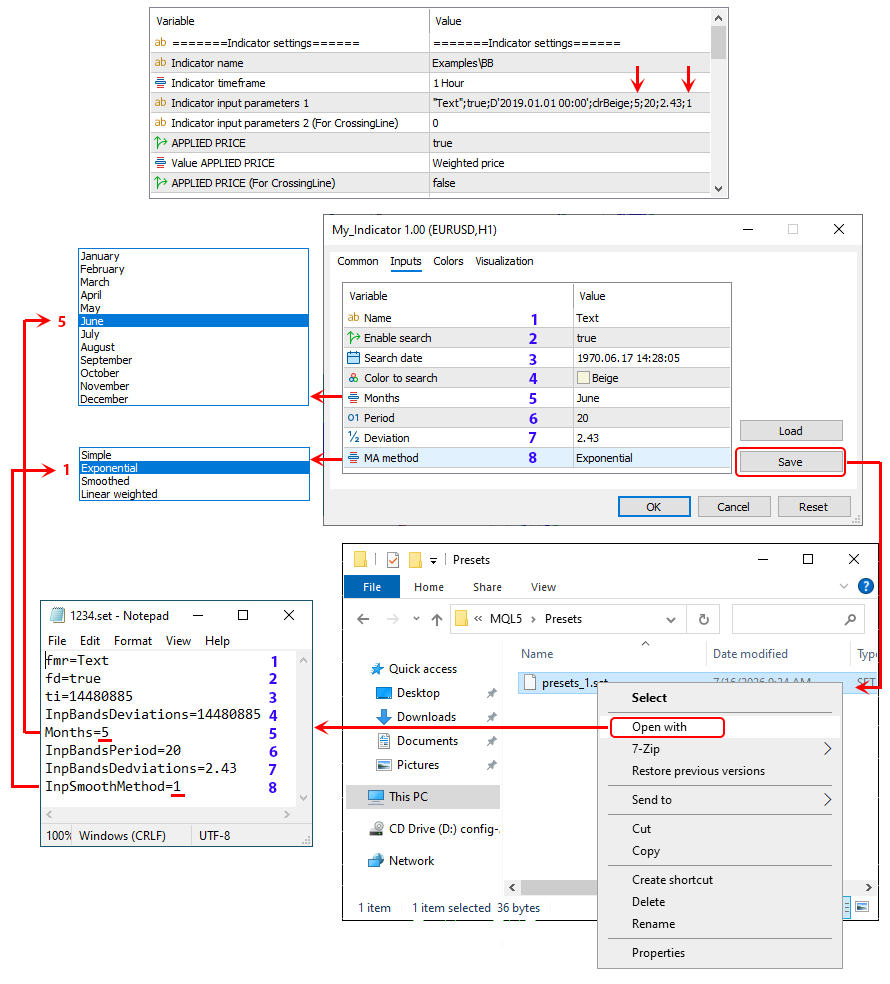
This indicator supports up to 10 parameters. If a custom indicator has more than 10 parameters, only the default parameters will be applied. Default parameters will also be used if they are entered incorrectly or if the Indicator input parameters 1 field is left empty.
APPLIED PRICE & Value APPLIED PRICE
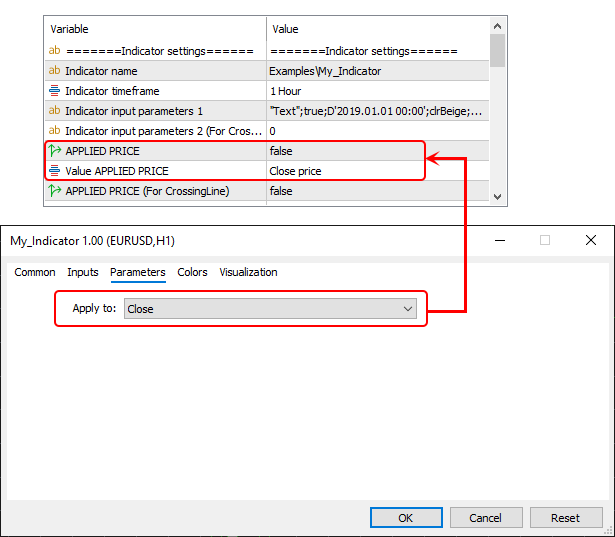
Turn on the APPLIED PRICE option and specify the price type (Value APPLIED PRICE) if the custom indicator has a Price Type parameter.
Indicator input parameters 2 (For CrossingLine)
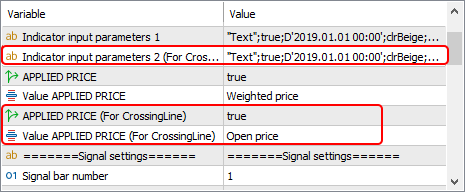
If you choose CrossingLine (crossing of two indicator lines) as the pattern, enter the settings for the second indicator in the Indicator input parameters 2 (For CrossingLine) field (the procedure for filling in the parameters is similar to Indicator input parameters 1).
Signal bar number
Set the signal candle number.
A signal candle is the candle on which the indicator checks for a signal (pattern), and this is where the signal arrow is placed.
Candle numbering starts from 0 and goes from right to left.
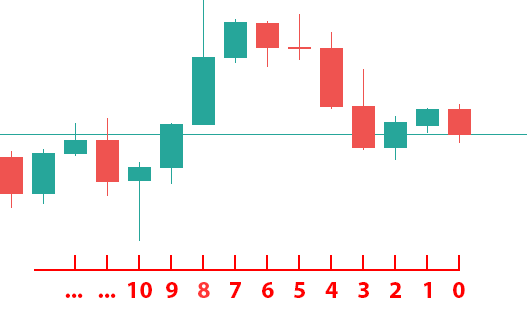
- Candle #0 is always the last candle on the right, which is changing in size and hasn’t closed yet.
- Candle #1 is always the second-to-last candle on the right, which has already closed and isn’t changing in size, and so on.
So, every time a new candle appears, the numbering shifts to the right, and the candle that was #0 becomes #1. For example, if you set the signal candle number to 1, the indicator will always check the signal on the second-to-last candle on the right.
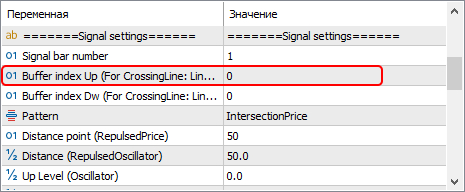
Buffer index Up (For CrossingLine: Line 1)
Set the buffer number of the indicator line for the Up signal. If the pattern type CrossingLine (crossing of two indicator lines) is selected, enter the buffer number for the first indicator line here.
An indicator buffer is a special dynamic array used to store data of a custom indicator. Simply put, these buffers are where the indicator "accumulates" calculated values (like prices, oscillators, or signals) so it can later display them on the chart.
Each indicator line has its own buffer number, and your task at this stage is to determine the buffer number of the line that will generate the signal.
How do you determine a buffer number?
For example, let's take the Ichimoku indicator. For a signal, we’ll use the Tenkan sen line. Launch the custom Ichimoku indicator on the chart (remember, this indicator is in the Examples folder), and open the "Data Window" (this window shows the buffers of the indicator lines).
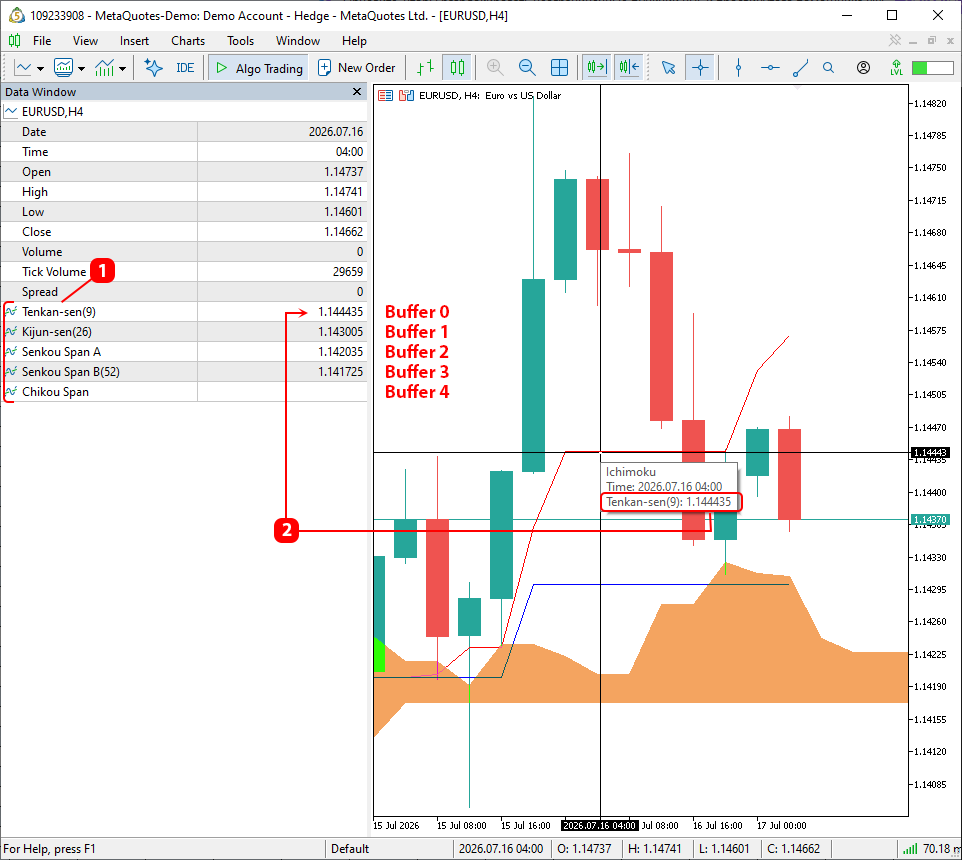
There are two ways to determine the buffer number:
- Most indicators have names for all their buffers, so you just need to hover the crosshair over the line and compare the names.
- If the line isn’t labeled, hover the crosshair over the line and compare the line’s price (value) with the prices of all the indicator buffers. The buffer you’re looking for will have the same price as the crosshair.
In our example, the desired buffer number is 0 (buffer numbering starts at 0 and goes from top to bottom).
Note that in rare cases, buffer numbering might not match the numbering in the data window (some buffers may be hidden), so after running the UniversalAlert indicator, be sure to check the readings of the selected buffers. See below for how to do this (parameter Show buffer).
Buffer index Dw (For CrossingLine: Line 2)
Set the buffer number of the indicator line for the Dw signal; if the pattern type CrossingLine (crossing of two indicator lines) is selected, enter the buffer number for the second indicator line here.
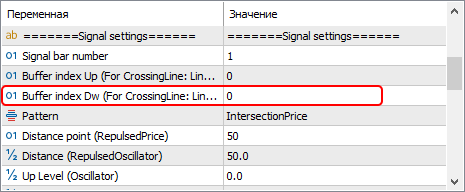
- Buffer index Up (line 1(CrossingLine)) — here we set the indicator buffer number for the Up signal; if the signal type CrossingLine is selected, here we enter the buffer number of the first indicator line.
- Buffer index Dw (line 2(CrossingLine)) — here we set the indicator buffer number for the Dw signal; if the signal type CrossingLine is selected, here we enter the buffer number of the second indicator line.
The values of Buffer index Up (line 1(CrossingLine)) and Buffer index Dw (line 2(CrossingLine)) can be the same if the same buffer is used for both the Up and Dw signals, for pattern the Bend pattern for moving averages.
Pattern
The indicator can detect seven types of signals (patterns).
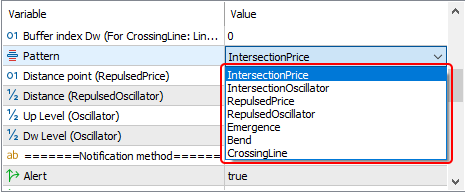
To recognize a pattern, the indicator line, levels on the indicator scale, as well as the opening, closing, low, and high prices of the candle are used.
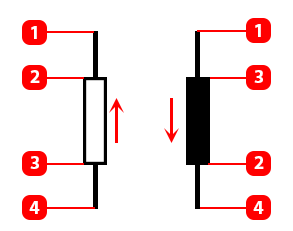
- High.
- Close.
- Open.
- Low.
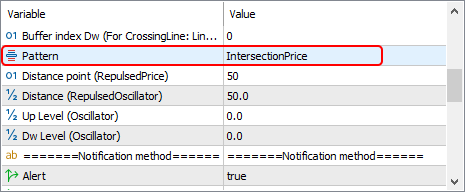
IntersectionPrice
Bar closing above/below the indicator line.
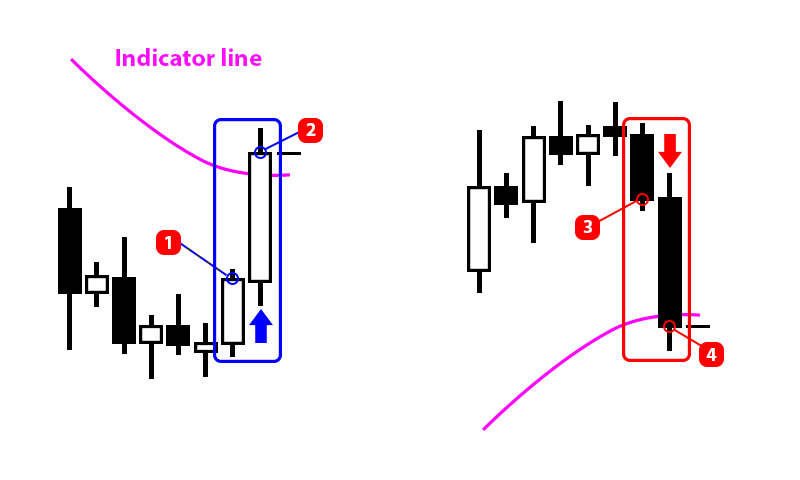
Up Signal:
The close price of the signal candle is above the indicator line ( 2 ).
The close price of the candle to the left of the signal candle is below the indicator line ( 1 ).
Down Signal:
The close price of the signal candle is below the indicator line ( 4 ).
The close price of the candle to the left of the signal candle is above the indicator line ( 3 ).
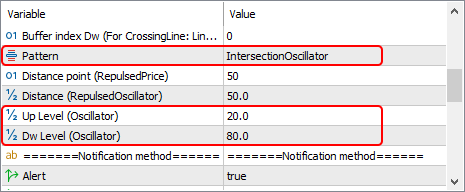
IntersectionOscillator
Crossing of the oscillator line with a specified level. The levels are set in the Up Line (Oscillator) and Dw Line (Oscillator) parameters.
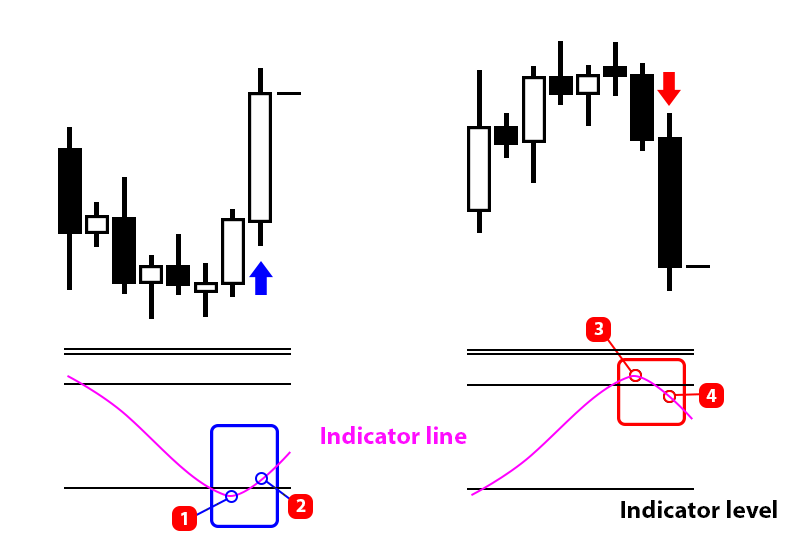
Up Signal:
The indicator line on the signal candle is above the Up Line (Oscillator) level ( 2 ).
The indicator line on the candle to the left of the signal candle is below the Dw Line (Oscillator) level ( 1 ).
Dw Signal:
The indicator line on the signal candle is below the Dw Line (Oscillator) level ( 4 ).
The indicator line on the candle to the left of the signal candle is above the Dw Line (Oscillator) level ( 3 ).
If the indicator line on the candle to the left of the signal candle equals the level, then the condition for that candle switches to the next candle to the left.
RepulsedPrice
Rebound from the indicator line, the signal is given if the candle breaks the line no deeper than specified by the Distance point (RepulsedPrice) parameter.
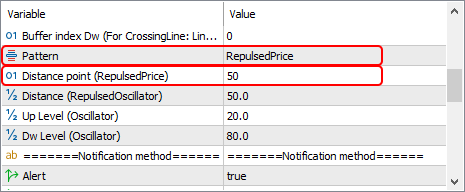
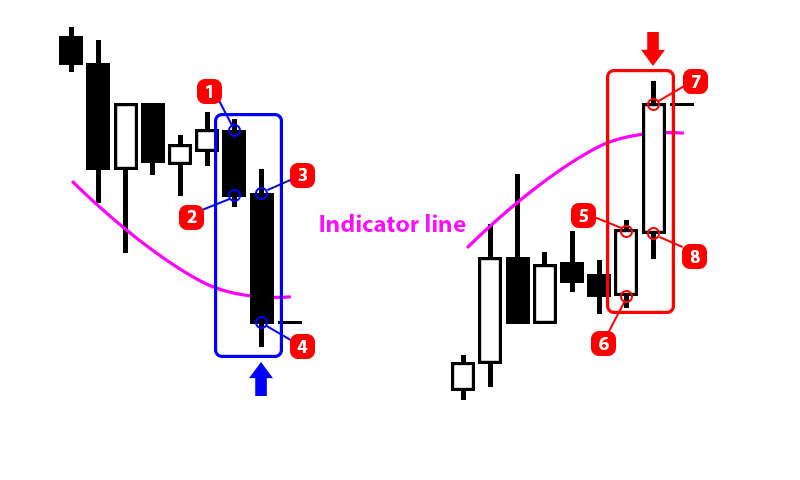
Up Signal:
The Close price of the signal candle is below the indicator line (4) and the distance from the candle's Close price to the indicator line is less than the value set in Distance point (RepulsedPrice).
The Open price of the signal candle is above the indicator line (3).
The Close price of the candle to the left of the signal candle is above the indicator line (2).
The Open price of the candle to the left of the signal candle is above the indicator line (1).
Сигнал Dw:
The Close price of the signal candle is above the indicator line ( 7 ) and the distance from the candle's Close price to the indicator line is less than the value set in Distance point (RepulsedPrice).
The Open price of the signal candle is below the indicator line ( 8 ).
The Close price of the candle to the left of the signal candle is below the indicator line ( 5 ).
The Open price of the candle to the left of the signal candle is below the indicator line ( 6 ).
RepulsedOscillator
Bouncing of the oscillator line from a set level. Levels are set in the Up Line (Oscillator) and Dw Line (Oscillator) parameters. The possible penetration depth is set in the Distance (RepulsedOscillator) parameter.
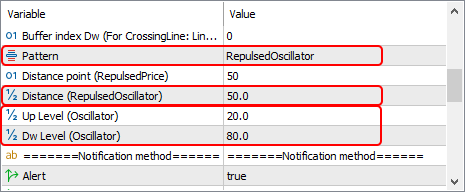
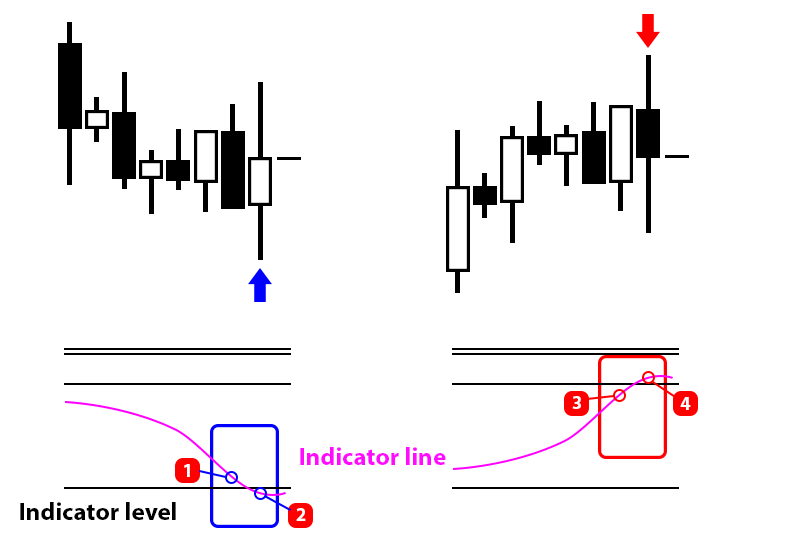
Up Signal:
The indicator line on the signal candle is below the Up Line (Oscillator) level ( 2 ) and the distance from the indicator line to the level is less than the value set in Distance (RepulsedOscillator).
The indicator line on the candle to the left of the signal candle is above the Dw Line (Oscillator) level ( 1 ).
Dw Signal:
The indicator line on the signal candle is above the Dw Line (Oscillator) level ( 4 ) and the distance from the indicator line to the level is less than the value set in Distance (RepulsedOscillator).
The indicator line on the candle to the left of the signal candle is below the Dw Line (Oscillator) level ( 3 ).
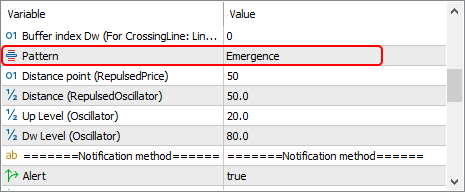
Emergence
Changing an empty or zero value in the indicator buffer to any value. This pattern supports two usage options:
- Buffer index Up (For CrossingLine: Line 1) != Buffer index Dw (For CrossingLine: Line 2) have different values, meaning that different buffers are used for the Up and Dw signals.
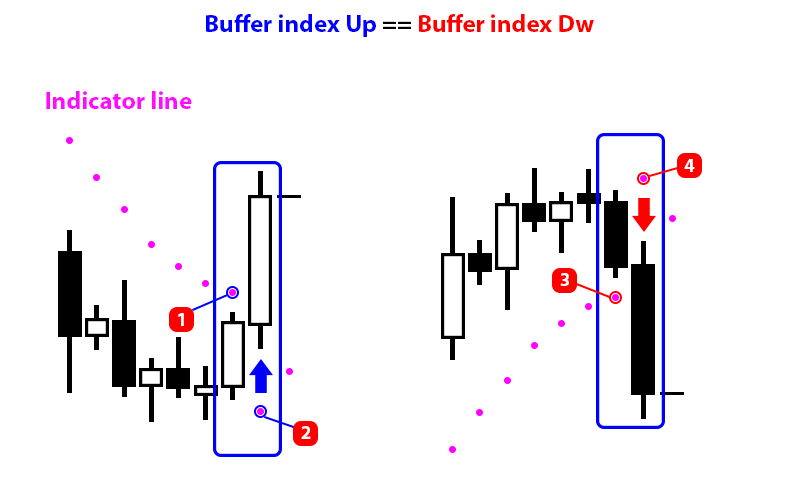
- Buffer index Up (For CrossingLine: Line 1) == Buffer index Dw (For CrossingLine: Line 2) have the same values, meaning that the same buffer is used for both Up and Dw signals. This option is used, for example, for the Parabolic SAR indicator.
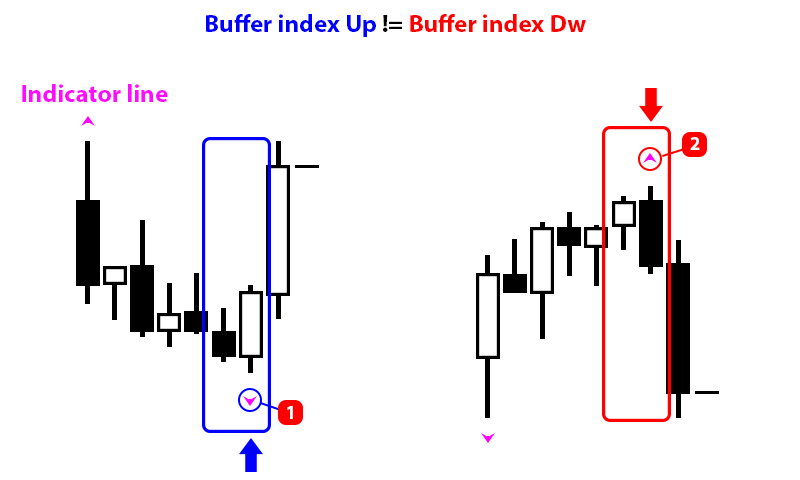
Up Signal:
The indicator line on the signal candle has a value greater or less than 0 ( 1 ) (not equal to 0 and not equal to EMPTY_VALUE (empty value)).
The indicator line on the candle to the left of the signal candle has a value of 0 or EMPTY_VALUE.
Down Signal:
The indicator line on the signal candle has a value greater or less than 0 ( 2 ) (not equal to 0 and not equal to EMPTY_VALUE (empty value)).
The indicator line on the candle to the left of the signal candle has a value of 0 or EMPTY_VALUE.
Up Signal:
The Low price of the signal candle is above the indicator line 2.
The High price of the candle to the left of the signal candle is below the indicator line 1.
Down Signal:
The High price of the signal candle is below the indicator line 4.
The Low price of the candle to the left of the signal candle is above the indicator line 3.
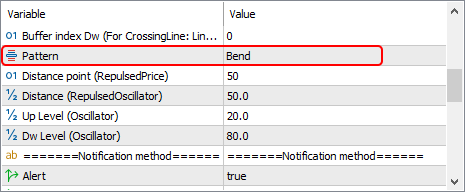
Bend
Bend of the indicator line.
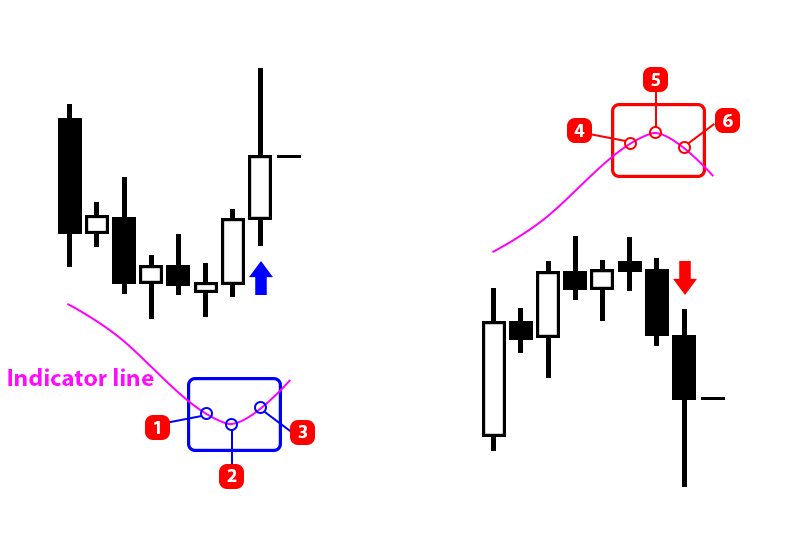
Up Signal:
The indicator line on the signal candle ( 3 ) is above the indicator line 2.
The indicator line 2 is below the indicator line 1.
Down Signal:
The indicator line on the signal candle ( 6 ) is below the indicator line 5.
The indicator line 5 is above the indicator line 4.
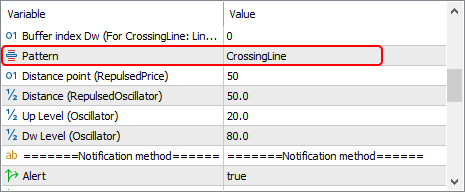
CrossingLine
Crossing of two indicator lines. Enter the parameters for the first line in Indicator input parameters 1, and for the second line in Indicator input parameters 2 (For CrossingLine).
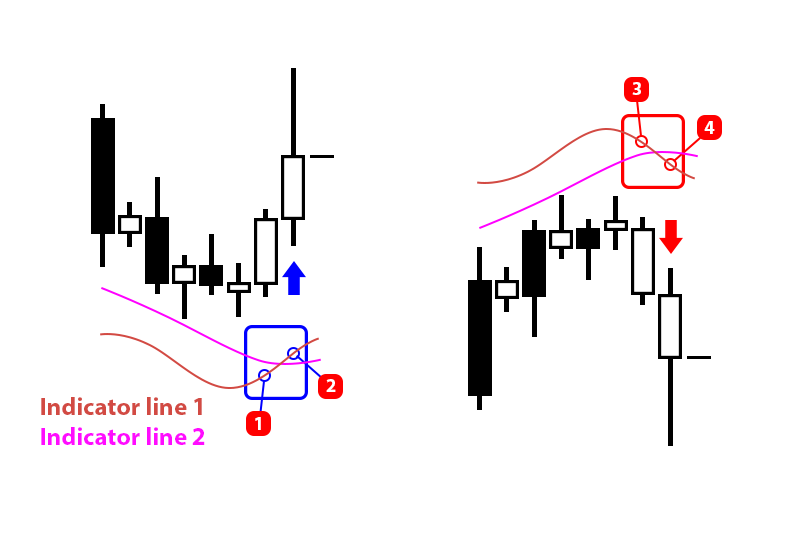
Up Signal:
Indicator line #1 on the signal candle is above indicator line #2 ( 2 ).
Indicator line #1 on the candle to the left of the signal candle is below indicator line #2 ( 1 ).
Down Signal:
Indicator line #1 on the signal candle is below indicator line #2 ( 4 ).
Indicator line #1 on the candle to the left of the signal candle is above indicator line #2 ( 3 ).
Notification Method
Choose a notification method.
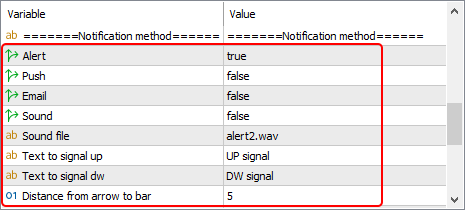
- Alert — pop-up window on the chart.
- Push — push notifications to your phone.
- Email — messages to your email.
- Sound — sound playback.
If Sound is selected, enter the name of the sound file in the Sound file field. The file must be located in the terminal_folder\Sounds directory or its subdirectory. Only WAV sound files are played.
If Alert, Push, or Email is selected, enter the message text in the Text to signal up and Text to signal dw fields.
For Push and Email, delivery addresses are set in the terminal settings. For more information, see the terminal manual.
In the Distance from arrow to bar field, set the offset of the signal arrow from the candle (in points).
Show indicator buffer values on the chart
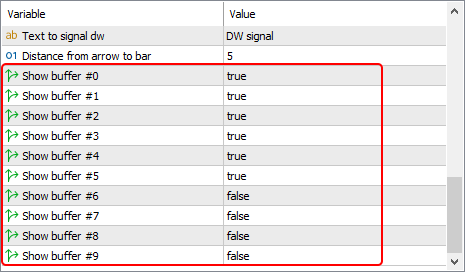
These settings include displaying the user indicator data on the chart. They are intended to check the correctness of the entered settings by comparing the data shown by the Universal Alert indicator with the data of the user indicator.
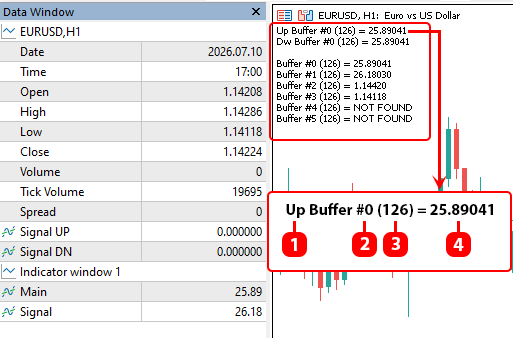
- Up or Dw - display data from the Up or Dw buffers.
- Buffer number.
- Candle number.
- Data from the buffer.
When you first launch the indicator, turn on these settings to make sure Universal Alert is set up correctly (see below).
That's it for setting up the indicator, and you can start checking the data.
How to Check the Correctness of Data Reading from a Custom Indicator Using the Universal Alert Indicator
- Run the configured Universal Alert indicator with the Show buffer option enabled.
- Run the configured custom indicator.
- Open the "Data Window".
- Hover your cursor or crosshair over the indicator line and compare the data. If the data matches, the settings are correct. Note that if the indicators have different data precision, rounding will occur according to mathematical rules; for example, 1.6787687 will be rounded to 1.67877.
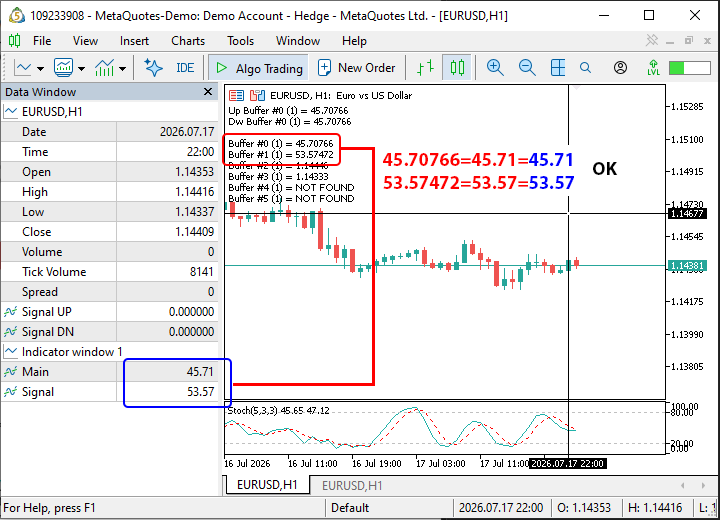
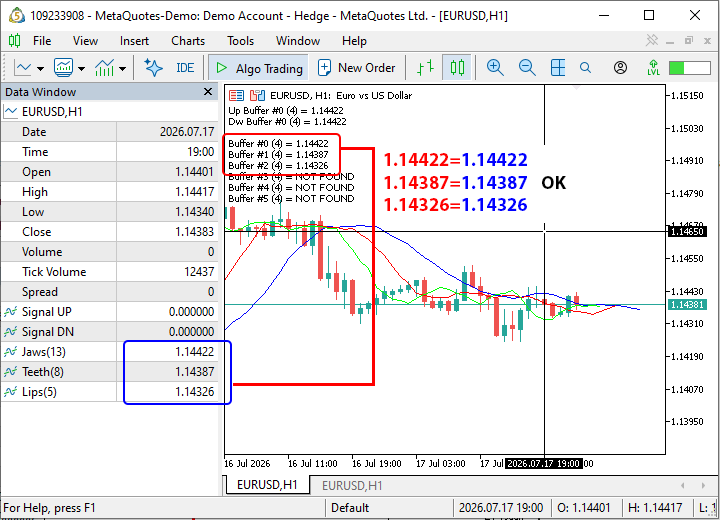
In this example, we connected the Universal Alert indicator to the Stochastic indicator, and in the second example — to the Alligator indicator. When you hover over any candle, the indicator data is identical, which shows that the custom indicators are connected correctly.
Next, you can start testing the signal.
How to Test Universal Alert in the Strategy Tester
To have a custom indicator displayed on the chart in the strategy tester, create a template for the strategy tester.
Set up the chart properties in a way that’s convenient for you (background, candle colors, etc.) and add your custom indicator to the chart with the settings you need.
Note: only a custom indicator should be installed on the chart; Universal Alert does not need to be installed, as it will be run by the strategy tester.
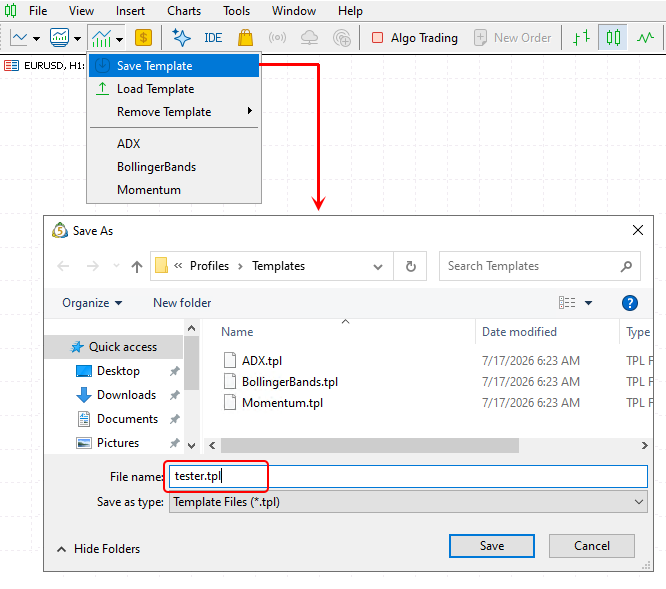
After that, save the chart as a template under the name tester.tpl.
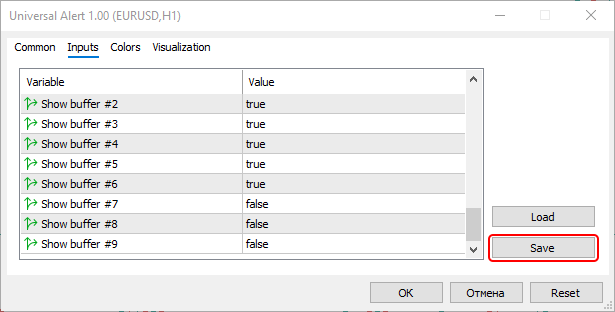
So that you don't have to fill in the settings for the Universal Alert indicator in the strategy tester, save the configured settings as a template under any name.
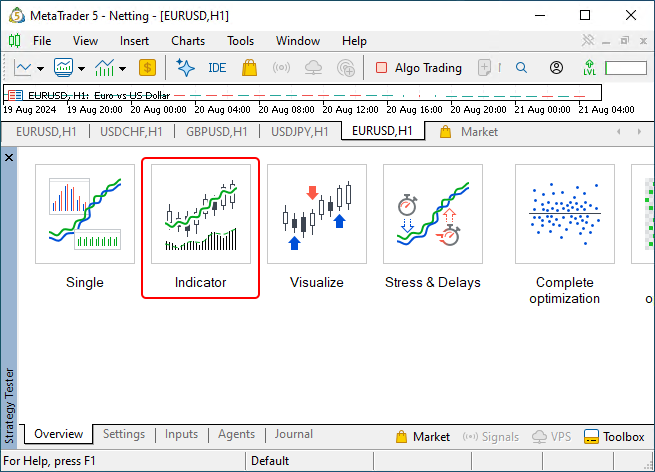
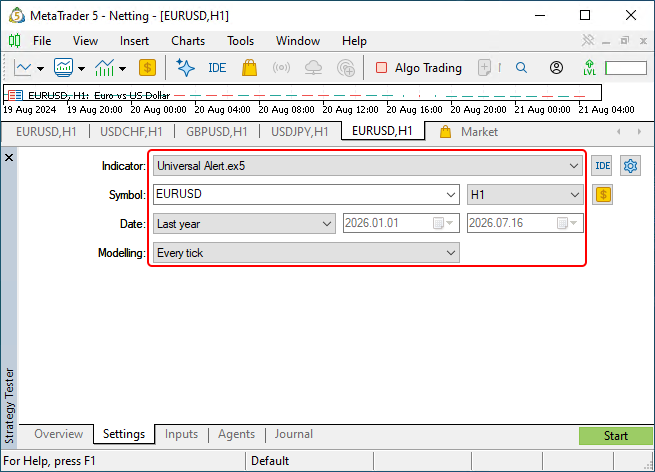
Go to the strategy tester and select the "Indicator" option.
Go to the settings tab and set the testing options.
Go to the Input Parameters tab, right-click on the tab, and select Load from the drop-down menu. Then choose the previously saved template for the Universal Alert indicator.
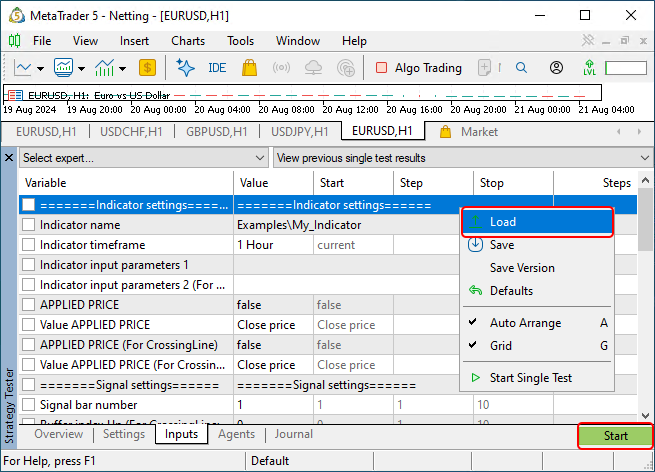
That's it for setting up the testing process, and you can start testing the signal by clicking the Start button.
Heads up! The indicator only works with current data and doesn't draw arrows on historical data, which ensures that there’s no arrow repainting. So, if you don’t see arrows on the history when you first run it, it’s not a mistake.
If you want to check signals on historical data, use the strategy tester for that.