
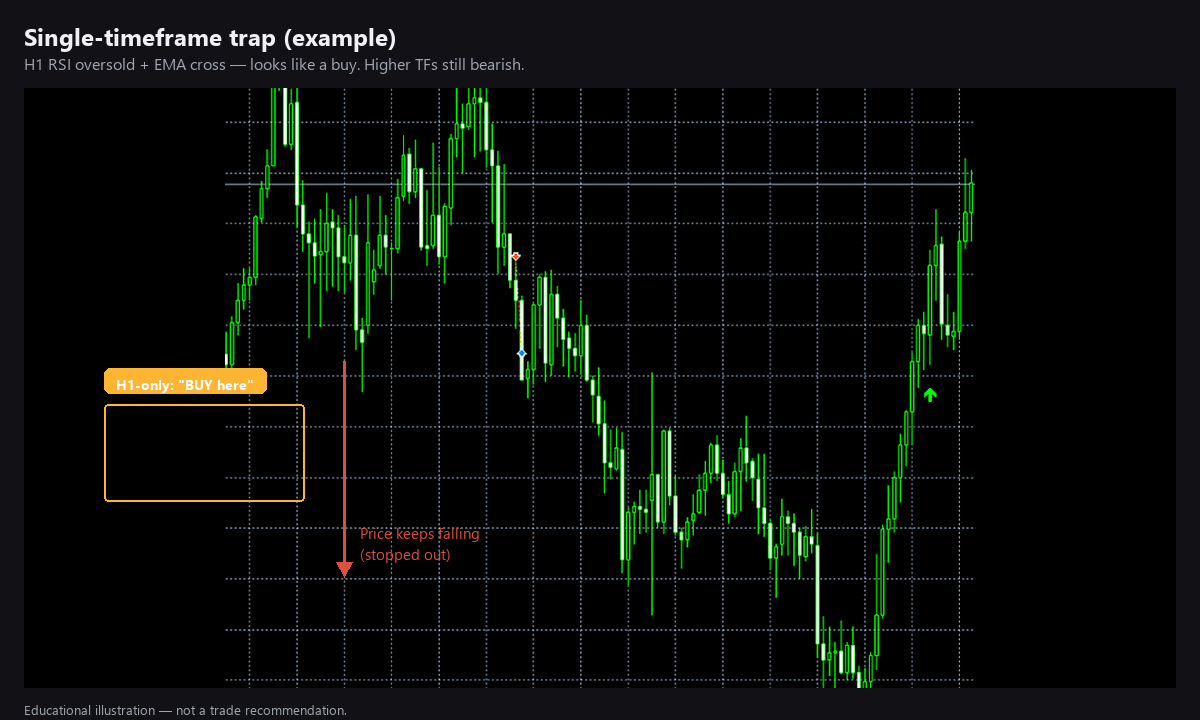
I still remember one GBPUSD long trade from a few years back that I should have never taken.
The H1 chart looked perfect. RSI was down in the high 20s, the fast EMA just curled up through the slow one. Classic oversold bounce setup. I entered with normal position size, tight stop below the recent swing low, feeling pretty smart about it.
Then price dropped another 40 pips before I finally bothered to check the H4 chart.
The H4 was still firmly bearish. Full downtrend structure intact, RSI nowhere near suggesting a long bias. What I thought was a reversal on H1 was just noise inside a much bigger sell move.
That trade taught me something important. The problem wasn't bad luck or a faulty indicator. The problem was I was only looking at one timeframe.
What Single-Timeframe Tools Miss
Here's the thing about RSI and EMA. They only react to whatever chart you're looking at. They have no idea what's happening on the higher timeframes.
A bullish signal on M15 means something completely different depending on whether H1 and H4 agree with it or not. When all three timeframes align, that signal has weight. When they're fighting each other, it's probably just noise.
I started keeping a simple log. Every time I considered a trade, I'd note whether I took it or skipped it, and why. After a few weeks the pattern was clear.
When I only checked H1, I had lots of setups but lots of doubt. When I started requiring M15, H1, and H4 to agree, I took fewer trades but felt much more confident about the ones I did take.
I didn't need a better oscillator. I needed a rule for when NOT to click buy.
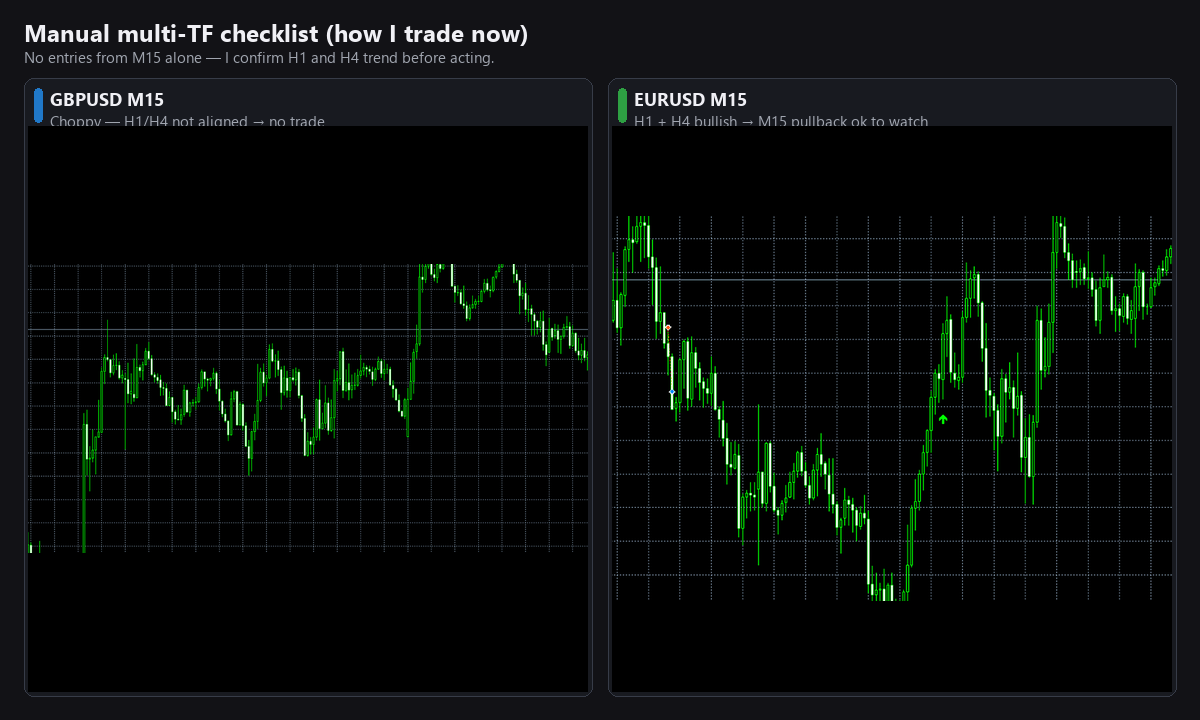
The Checklist I Actually Use
Nothing fancy here. Just three charts of the same symbol open at the same time.
First, I look at M15, H1, and H4 side by side. On each timeframe I check if the fast EMA (21) is above or below the slow EMA (55). Above means bullish structure, below means bearish.
Then I check RSI(14) on the last closed bar. For a long bias I want to see RSI above 55, not just barely above 50. For shorts I want it below 45.
My rule is simple. I only take M15 long ideas if at least 2 out of 3 timeframes agree on the direction. Same for shorts. If M15 looks great but H1 and H4 are fighting each other, I skip it. No exceptions, especially not at 2am when I'm tired.
A few small habits that actually helped me.
I write one line in my journal for every trade I skip. Something like "M15 long idea, H4 bearish, passed." Sounds pointless but it reinforces the discipline.
I use the same rule on gold and indices. The process doesn't change just because the symbol does.
And I only make decisions on closed bars for H1 and H4. I've gotten burned too many times by wicks that reversed right at the hour close.
Final Thought
If you've been getting stopped out on what looked like perfect RSI reversals, try checking the timeframe above yours before your next entry. Sometimes the fix isn't a new indicator or a different setting. Sometimes it's just one extra chart.
I've been trading this way for a while now and it's made a real difference in my consistency. Happy to discuss in the comments if you have questions. This is just what works for me, not advice for anyone else's account.
Not financial advice. Personal notes only. Past results don't guarantee future performance.


 & AMD Framework")
