Title The Math of Drawdown Recovery Most Traders Get Wrong

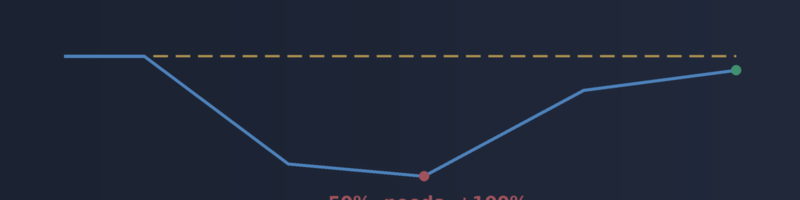
Here's a number that surprises a lot of traders the first time they actually calculate it: if your account drops 50% from its peak, you don't need a 50% gain to get back to even. You need 100%. A 20% drawdown needs a 25% recovery. A 10% drawdown needs about 11%. The math isn't symmetric, and the deeper the hole, the worse the asymmetry gets.
Why the math works this way
A loss and a gain of the same percentage aren't calculated against the same base. Lose 50% of $10,000 and you have $5,000 - to get back to $10,000 from $5,000, you need a 100% gain, not 50%, because you're now calculating the percentage against a smaller starting number. This compounds the deeper you go: a 75% drawdown needs a 300% gain just to break even. A 90% drawdown needs 900%.
Why this matters more than your raw balance does
Two accounts can have the identical balance today and be in completely different situations. One might be sitting at its all-time high. The other might be 40% below its peak, quietly needing a much larger recovery than its current balance alone suggests. The balance number doesn't tell you which one you're looking at - you need to know the peak to know how deep you actually are.
The part that's easy to lose track of while it's happening
During an actual drawdown, it's surprisingly easy to lose precise track of exactly how deep it got. You remember "it was a rough month," but the exact peak-to-trough percentage tends to blur once you're back to making money again - which matters, because that number is directly informative about how much risk you were actually carrying, whether your position sizing needs rethinking, and whether a similar-looking rough patch in the future is actually as bad as this one was or not.
What I built
SmartTrader Drawdown Tracker keeps a running, precise answer to three questions: where's your peak, how far below it are you right now, and how far below it did you get at the worst point. It also tracks today's P&L separately, and shows a live mini equity curve so the shape of what's happening is visible, not just a single number.
The peak-tracking and drawdown-percentage calculation isn't a new formula built just for this - it's the same one used in the drawdown circuit breaker inside SmartTrader AI Pro's Expert Advisor, validated against real Strategy Tester results. This tool surfaces that same measurement for any account, independent of what strategy or symbol you're actually trading.
Get it
On the Market: https://www.mql5.com/en/market/product/186912
From the same developer as SmartTrader AI Pro: https://www.mql5.com/en/market/product/186191