")
Analyzing Weekly Market Reversals with Murrey Math Classic (June 01 - June 05)

Analyzing Weekly Market Reversals with Murrey Math Classic (June 01 - June 05)
Hello Trading Community,
Mathematical analysis of price action provides some of the most reliable pivot points in modern trading. This past week, from June 1st to June 5th, I closely tracked the efficiency of the Murrey Math Classic indicator across multiple daily sessions.
The empirical results highlight how geometric support and resistance lines act as natural psychological boundaries for financial instruments. Below is the detailed chronological breakdown of the week's trading performance, mapping exact execution points based on the Murrey grid layers:
🔗 Access the Tool Here: Get Murrey Math Classic Indicator
📅 Daily Trading Architecture & Execution Points
I have attached specific chart captures demonstrating the indicator's real-time accuracy and the exact entry logic utilized throughout the week:
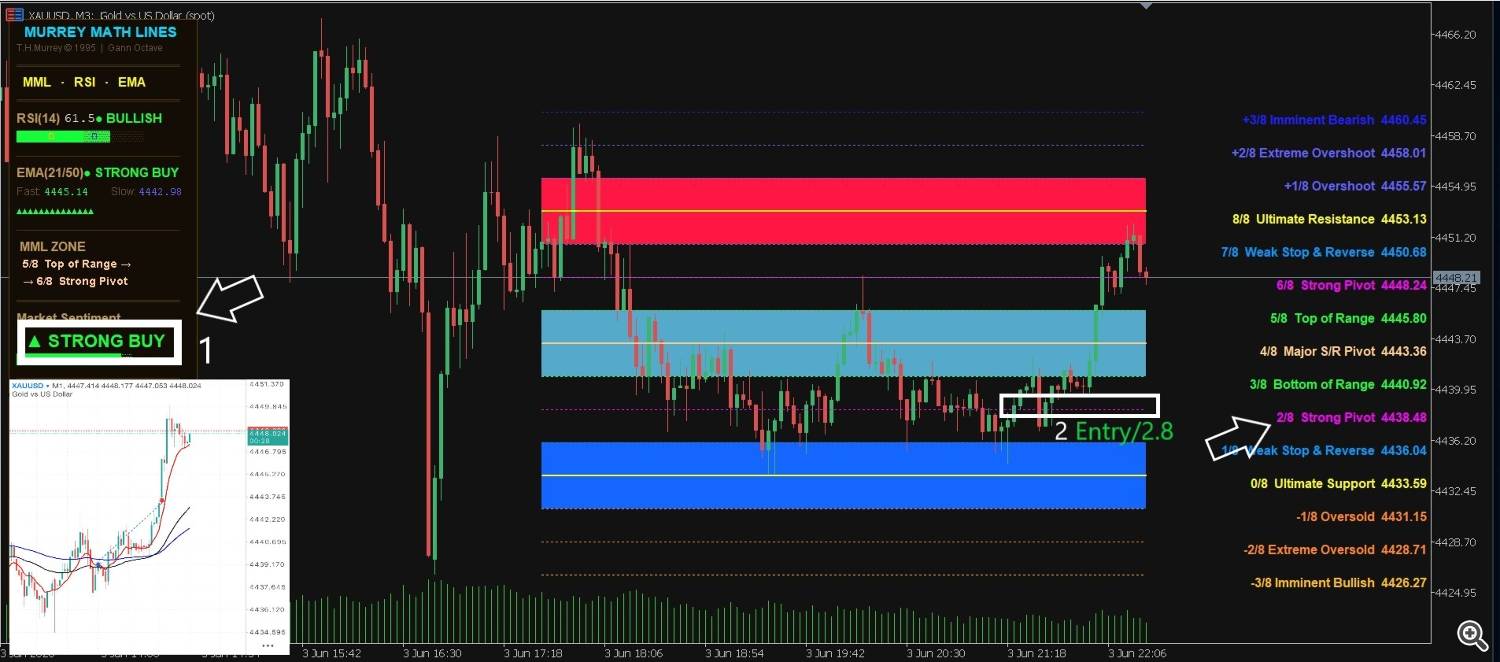
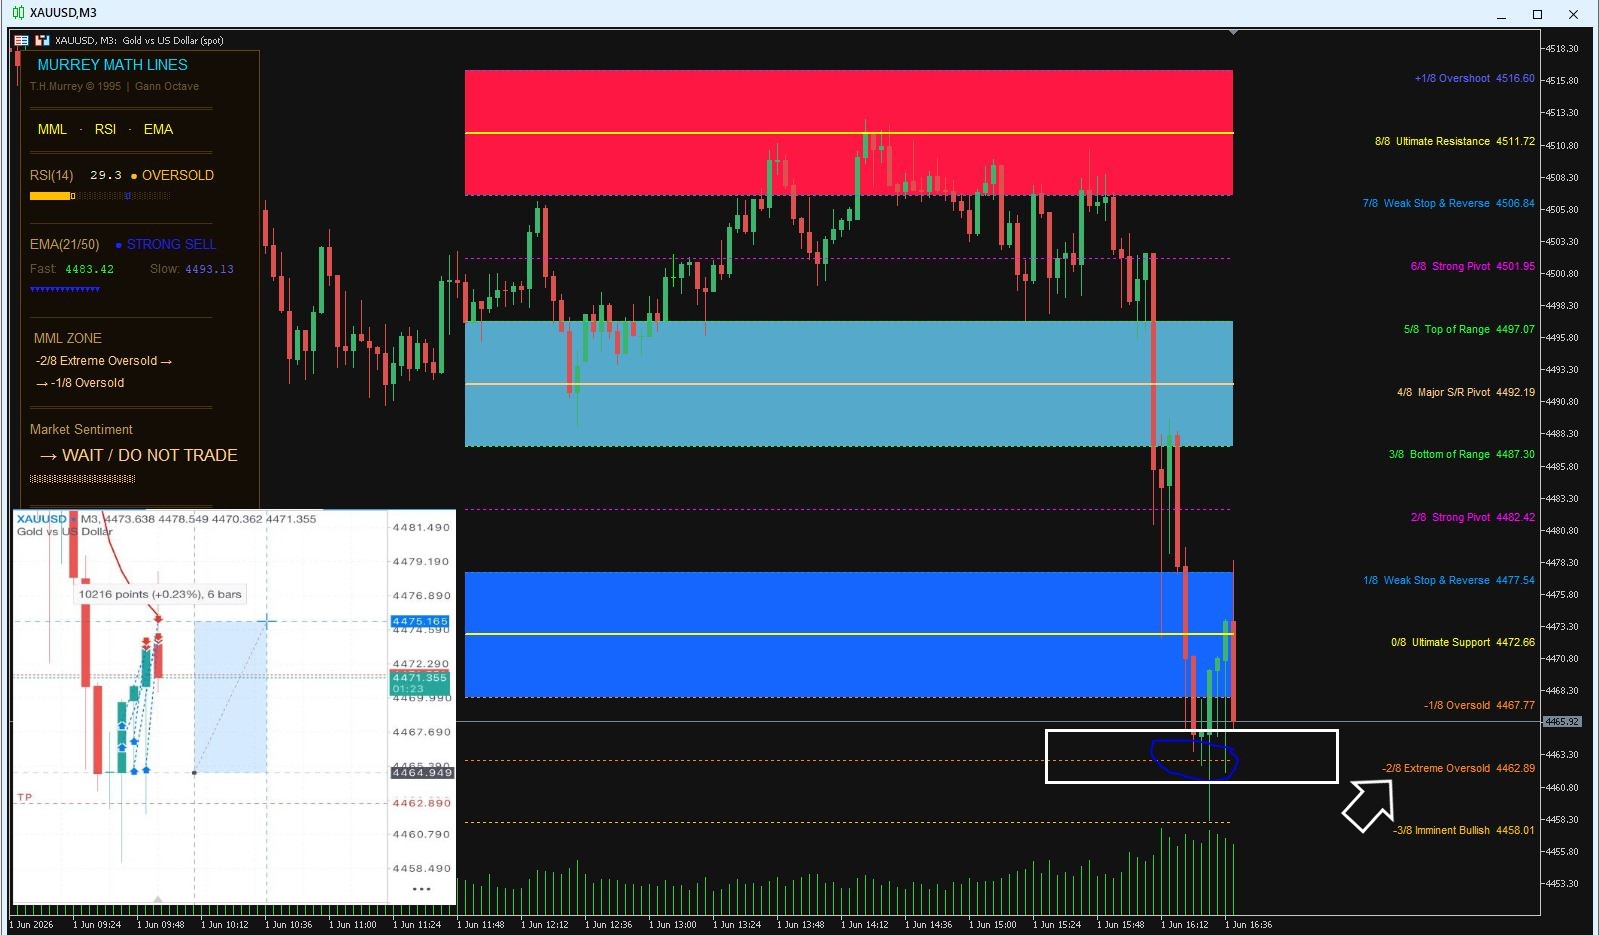
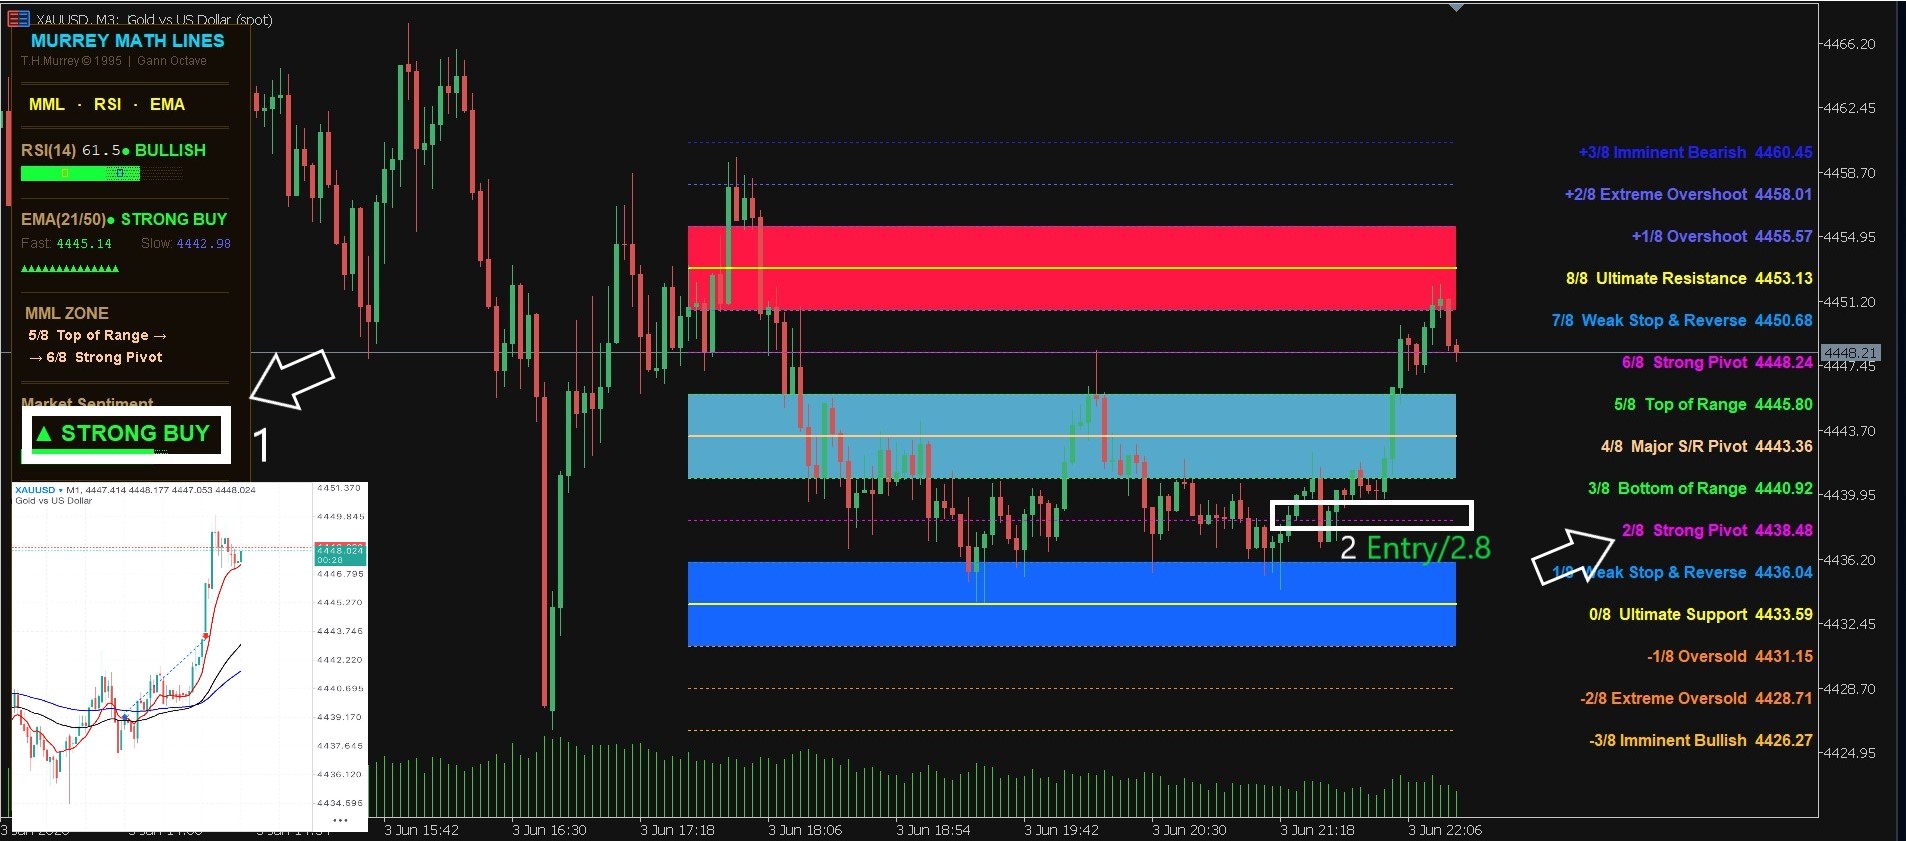
- Screenshot 1 (June 1st - Entry 1): Captured a high-probability long (Buy) position at the [-2/8] Extreme Oversold zone, anticipating a sharp mathematical exhaustion reversal.
-
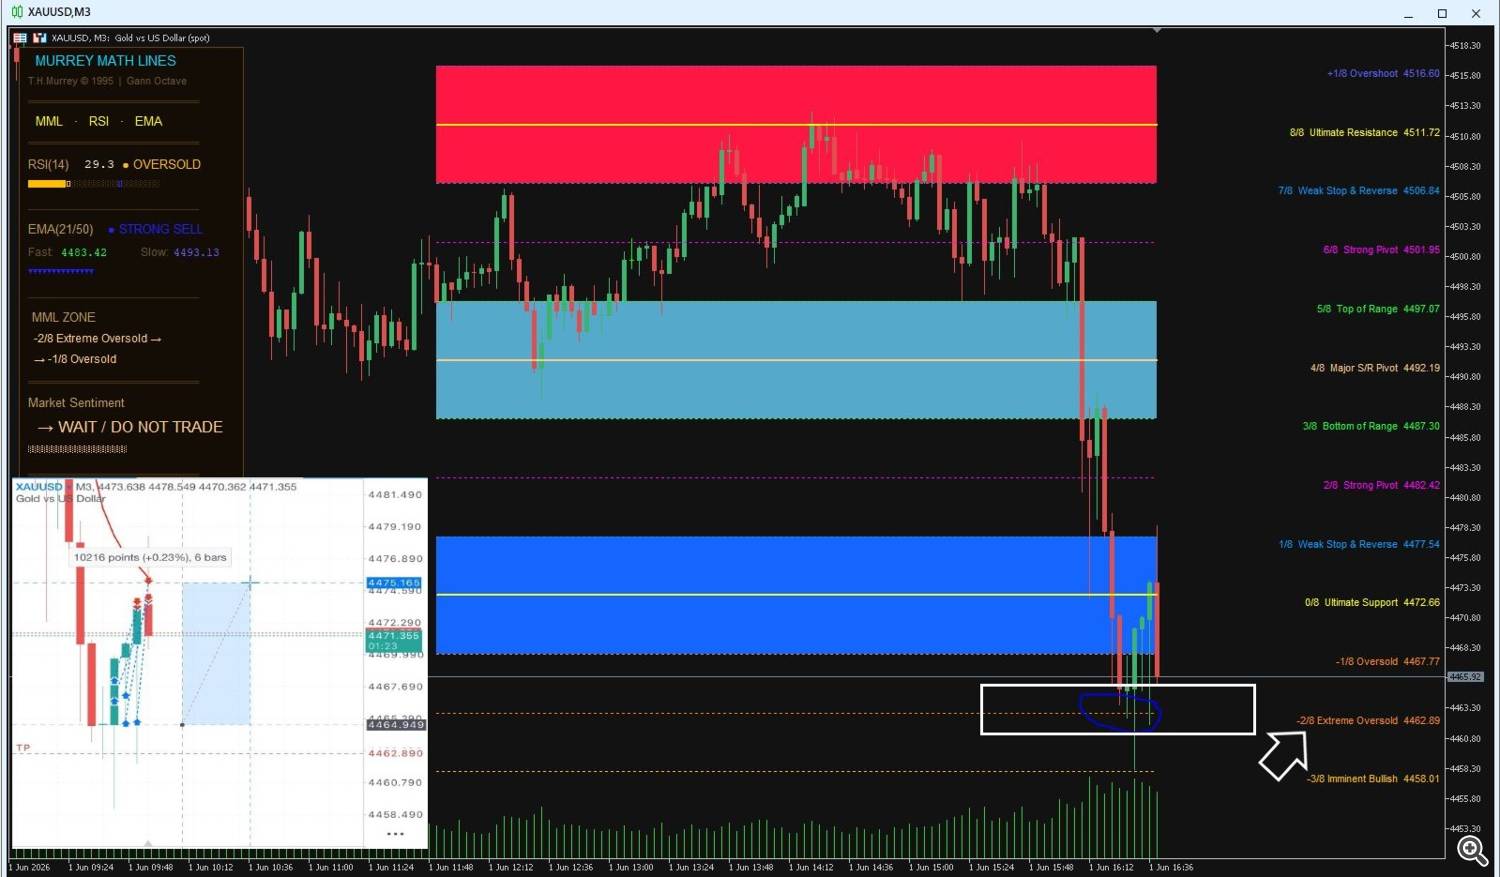
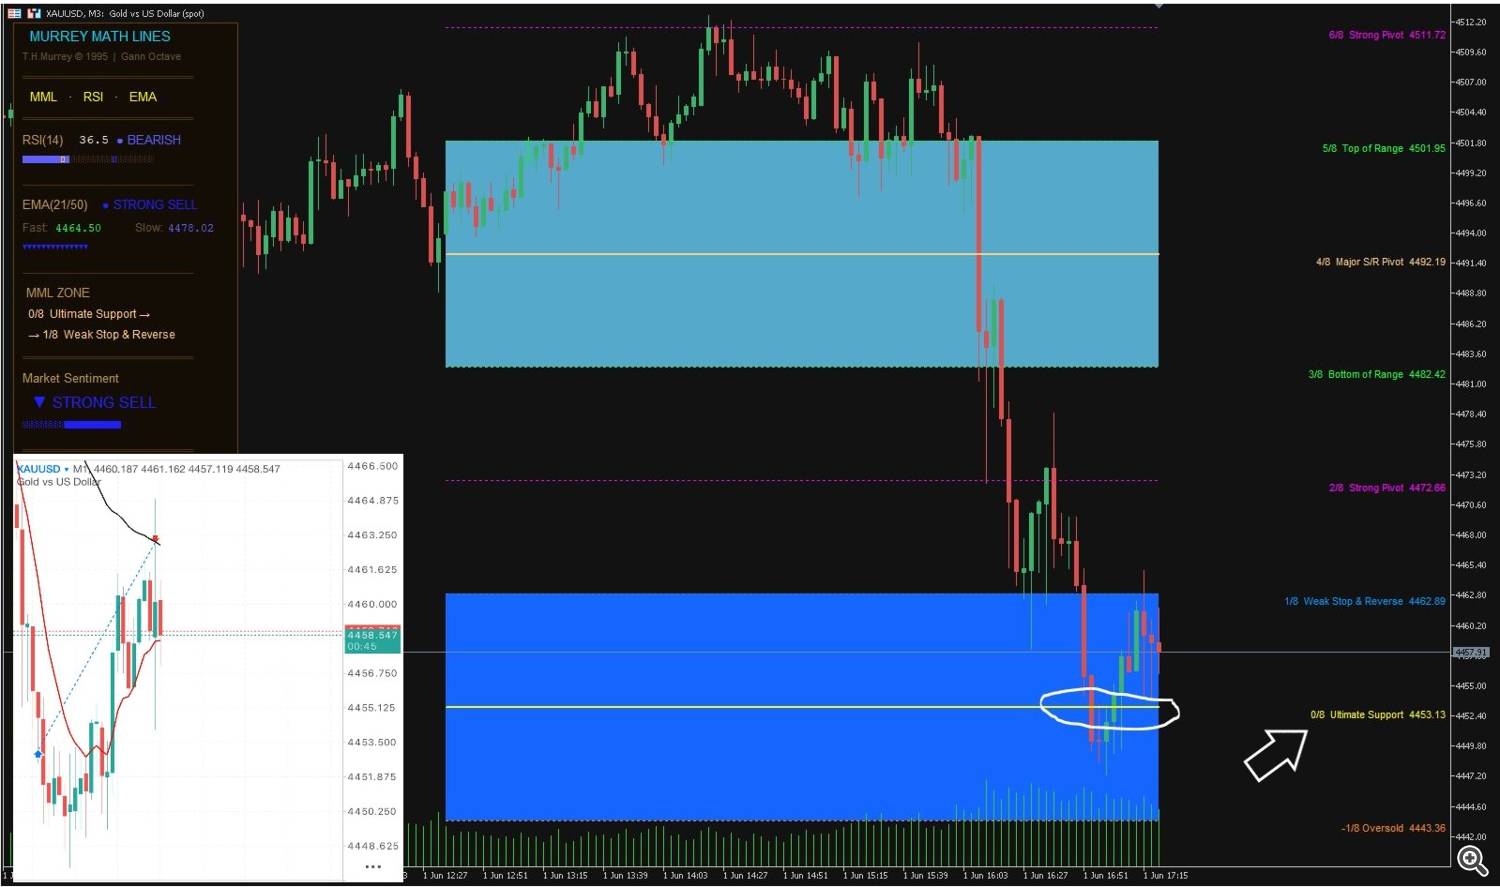
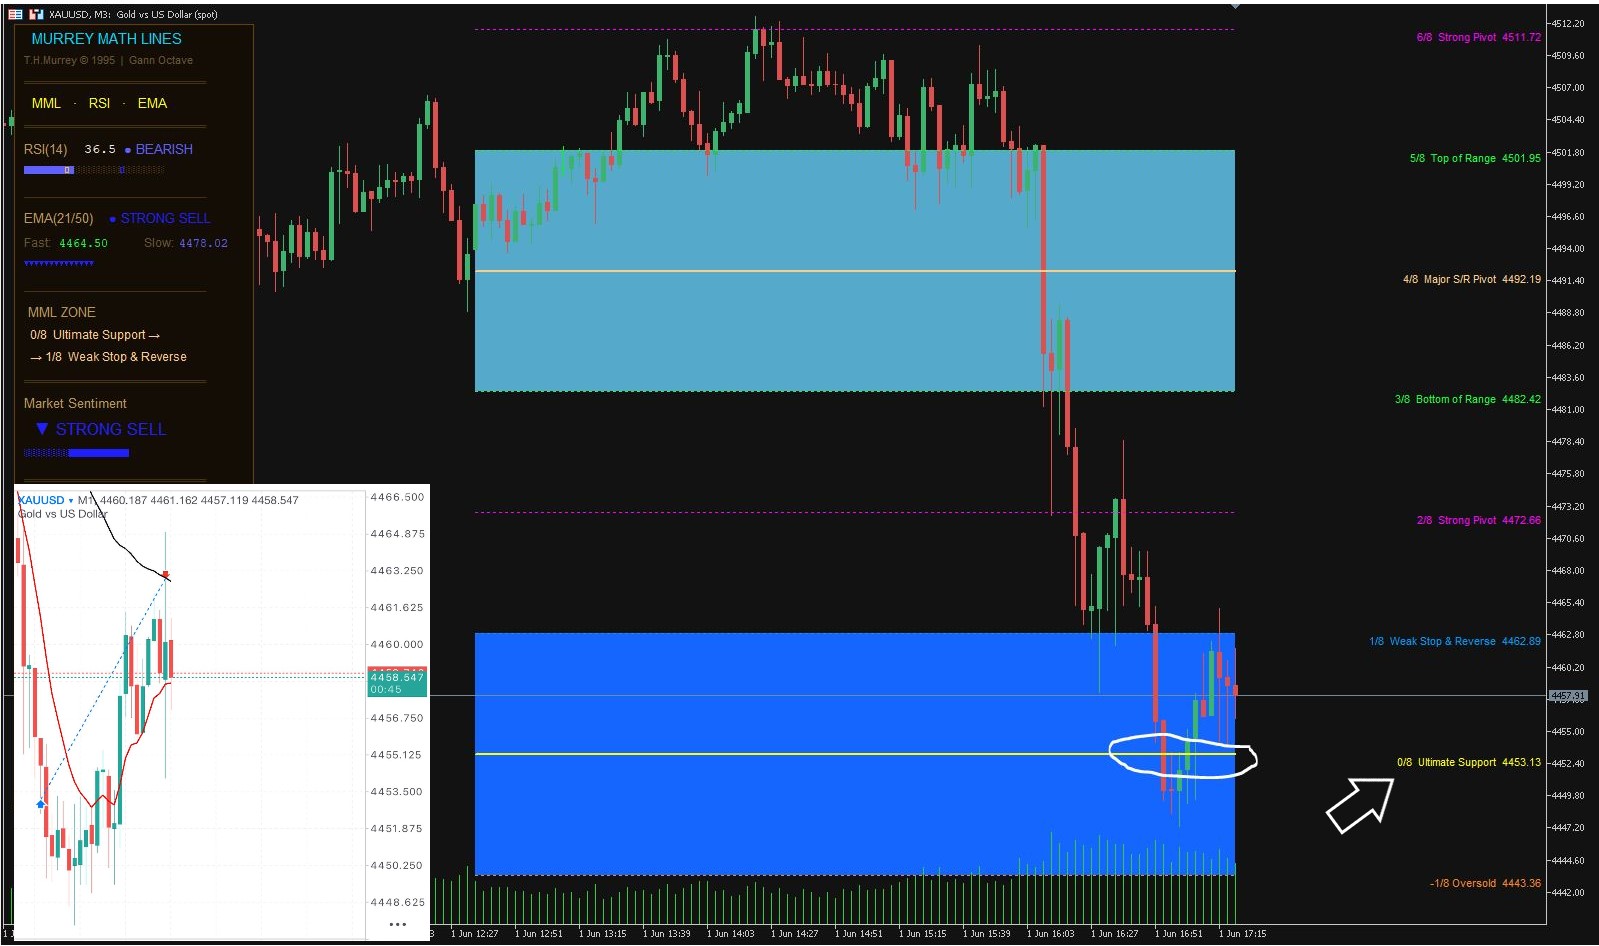
- Screenshot 2 (June 1st - Entry 2): Added a second long (Buy) confirmation dynamic precisely as price tested the [0/8] Ultimate Support line, locking in structural baseline momentum.
-
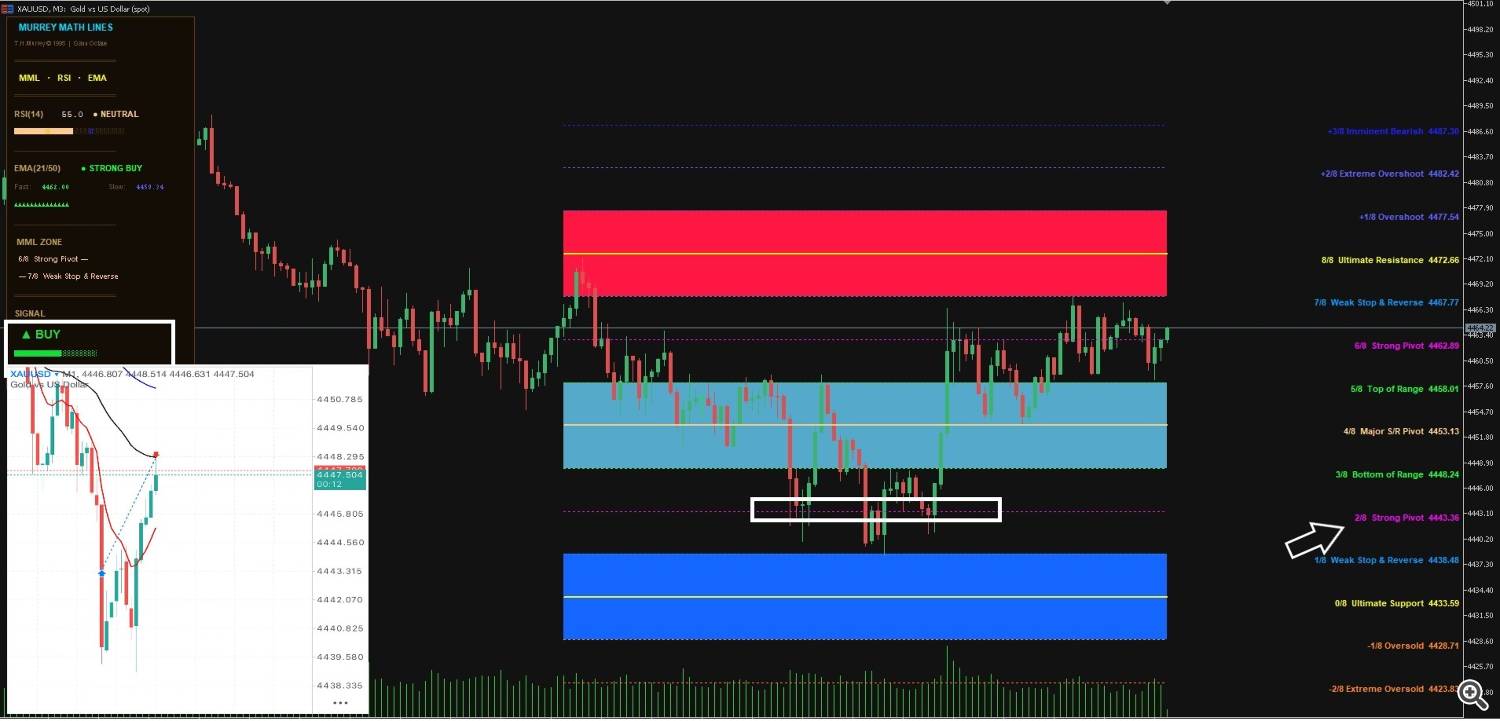
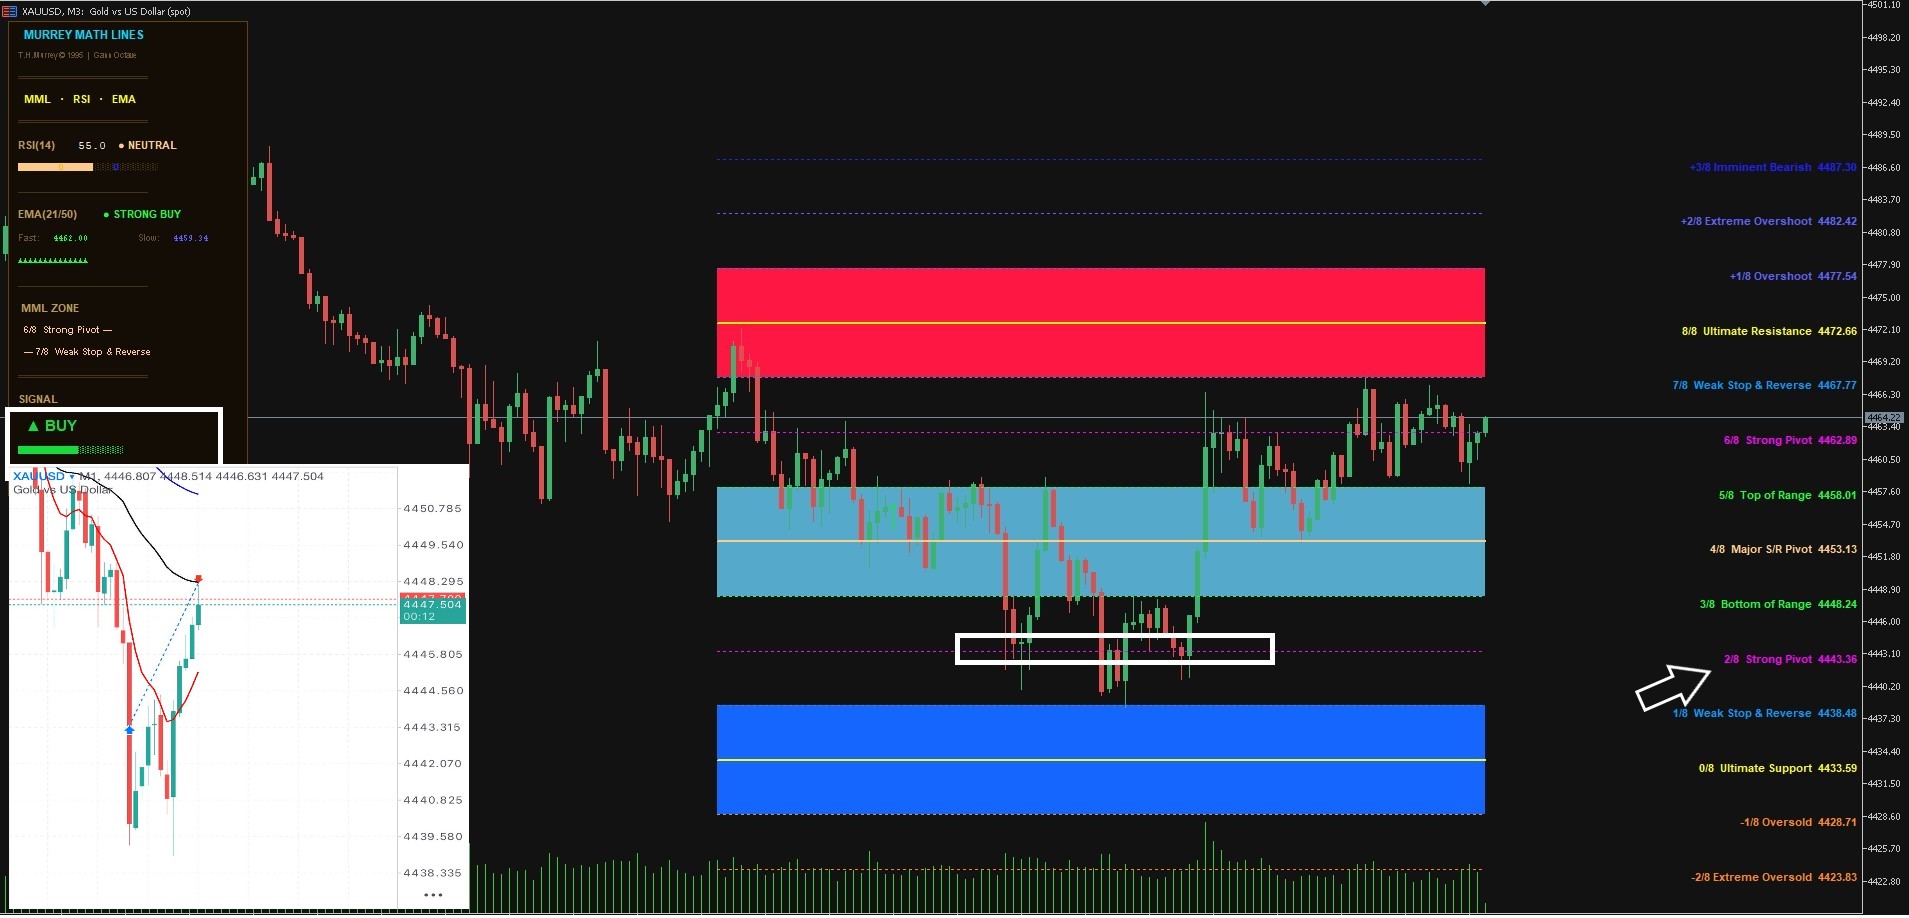
- Screenshot 3 (June 2nd): Executed a precise long (Buy) entry at the [2/8] Strong Pivot t extension layer, identifying structural trend exhaustion at the absolute peak.
-

- Screenshot 4 (June 3rd - Entry 1): Initiated a long (Buy) position directly off the [2/8] Pivot, Reverse (Strong Pivot) line during early session volume expansion.
-
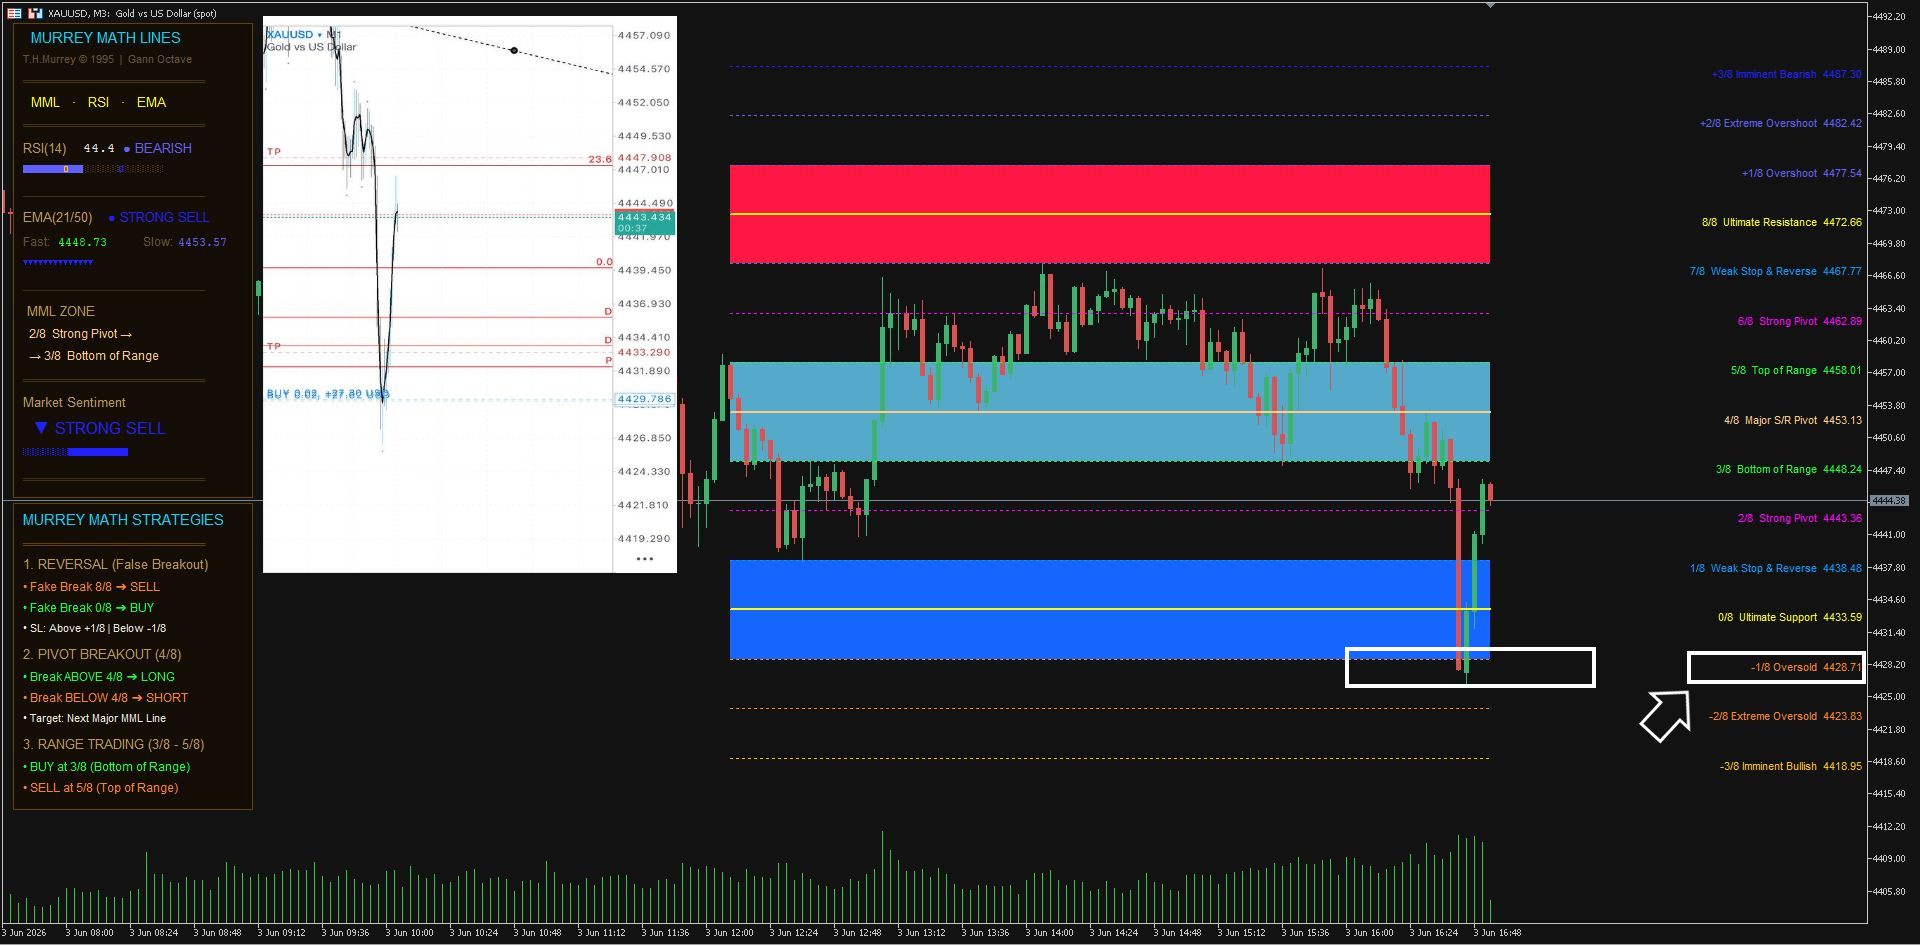
- Screenshot 5 (June 3rd - Entry 2): Scalped a secondary long (Buy) order following a temporary retracement into the [-1/8] Weak, Place to Stop (Oversold) level.
-
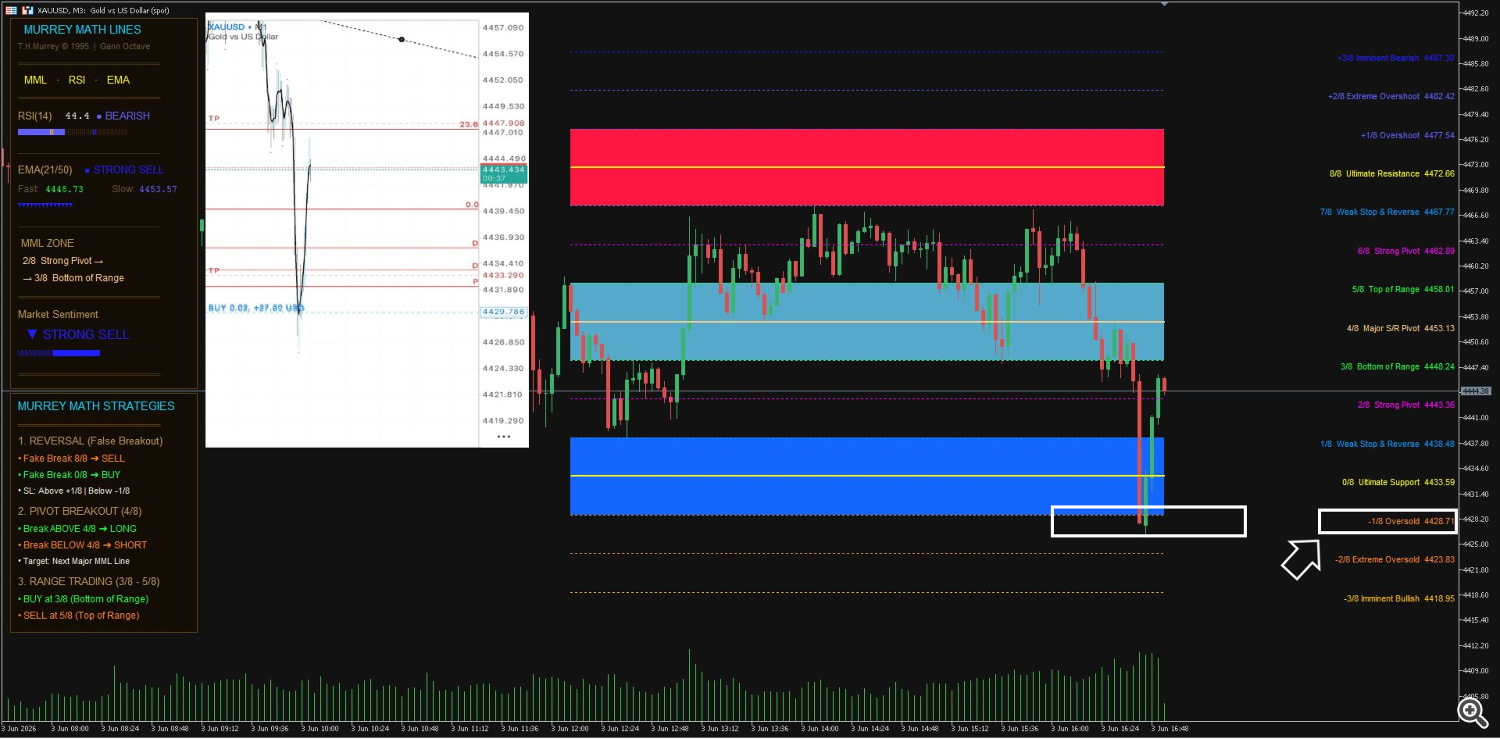
- Screenshot 6 (June 3rd - Entry 3): Confirmed the ongoing bullish structure with a third long (Buy) re-entry as price consolidated back above the [2/8] Strong Pivot barrier.
-
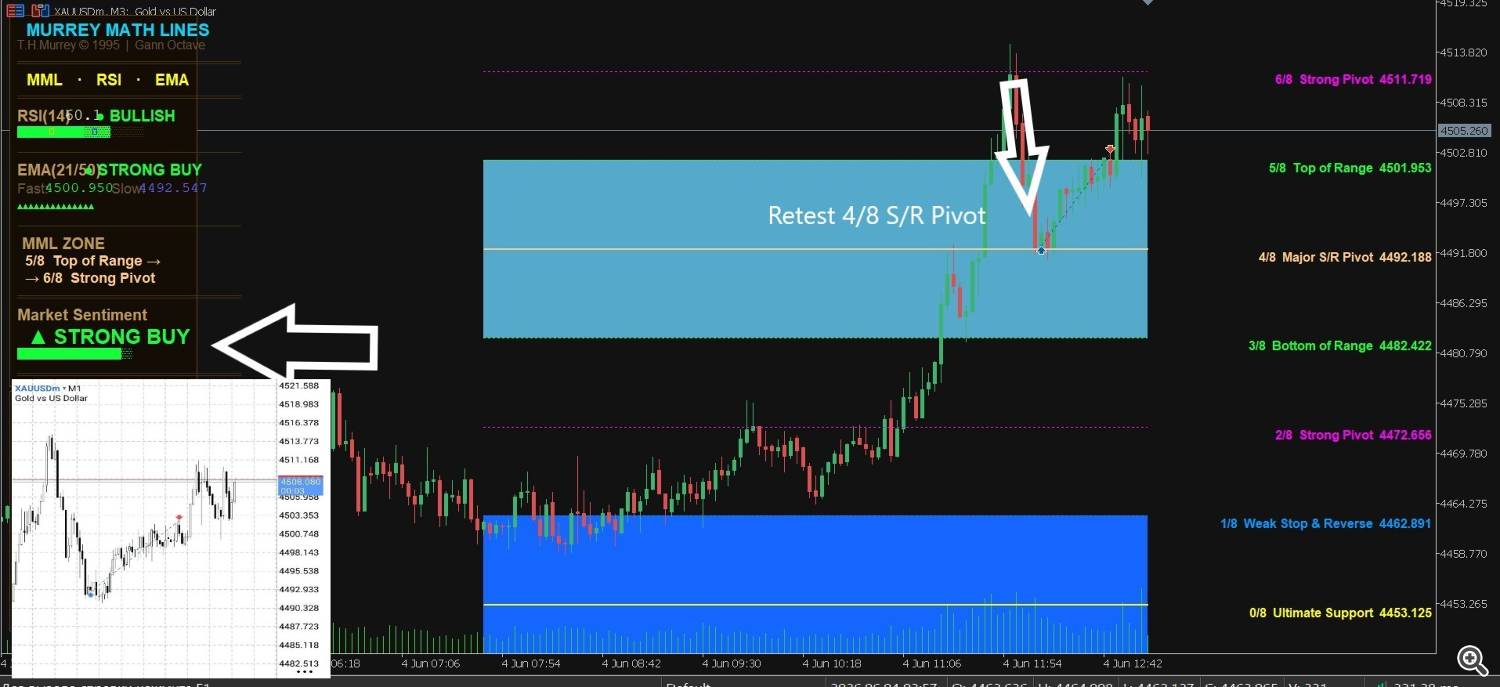
- Screenshot 7 (June 4th): Executed a safe trend-continuation long (Buy) position directly from the major psychological node: the [4/8] Major Support/Resistance Pivot line.
-
-
-
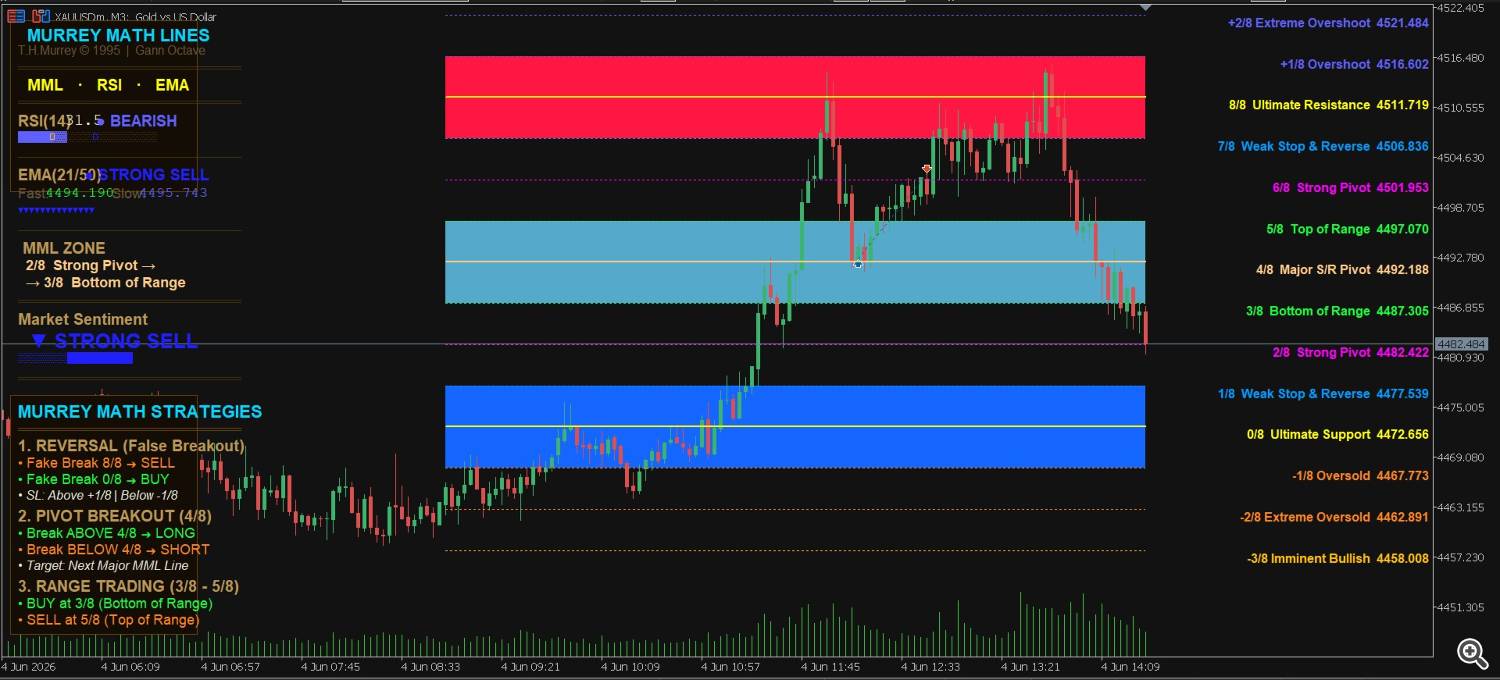
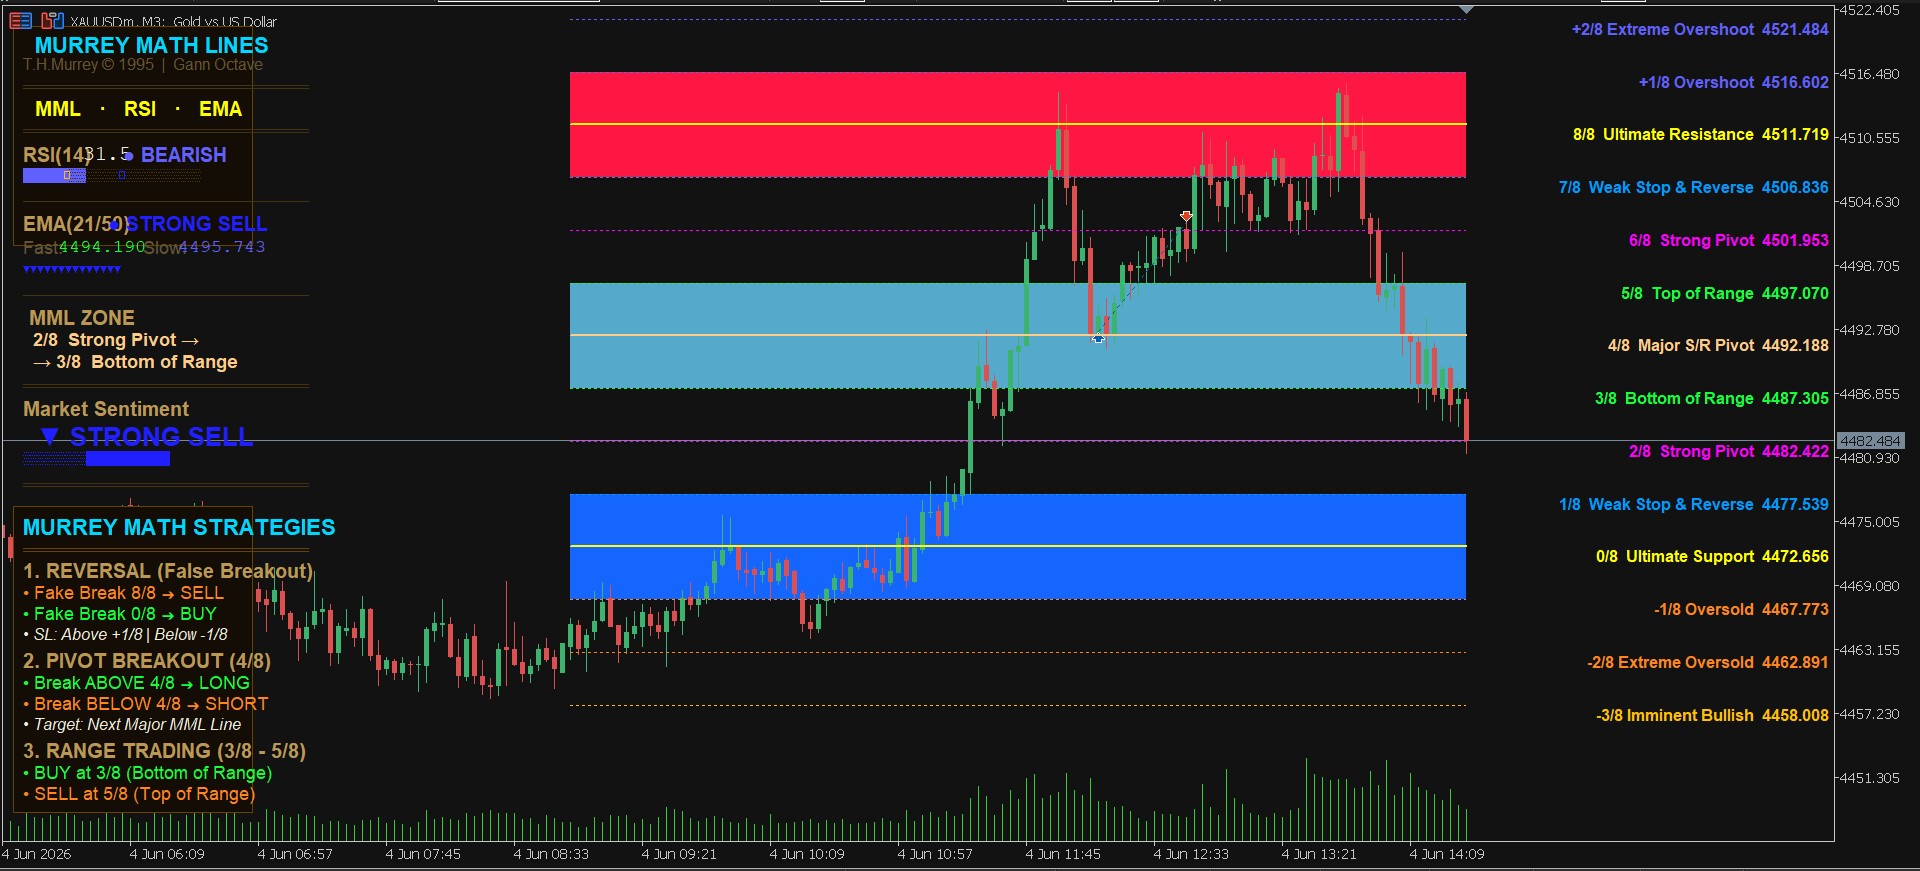
⚠️ Important Structural Update on M3 Timeframe:
We had a sharp drop from the 1/8 overshoot line. Since we scalp on the M3 timeframe, we skipped the initial sell entry because the dashboard was showing 'Strong BUY'. Following our strict system rules saves us from false reversals!
Now, the market context has changed. If the price pulls back to the 4/8 or 5/8 levels, we will actively look for a SELL entry since the M3 dashboard has now shifted and is currently showing a 'Strong SELL' signal.
-
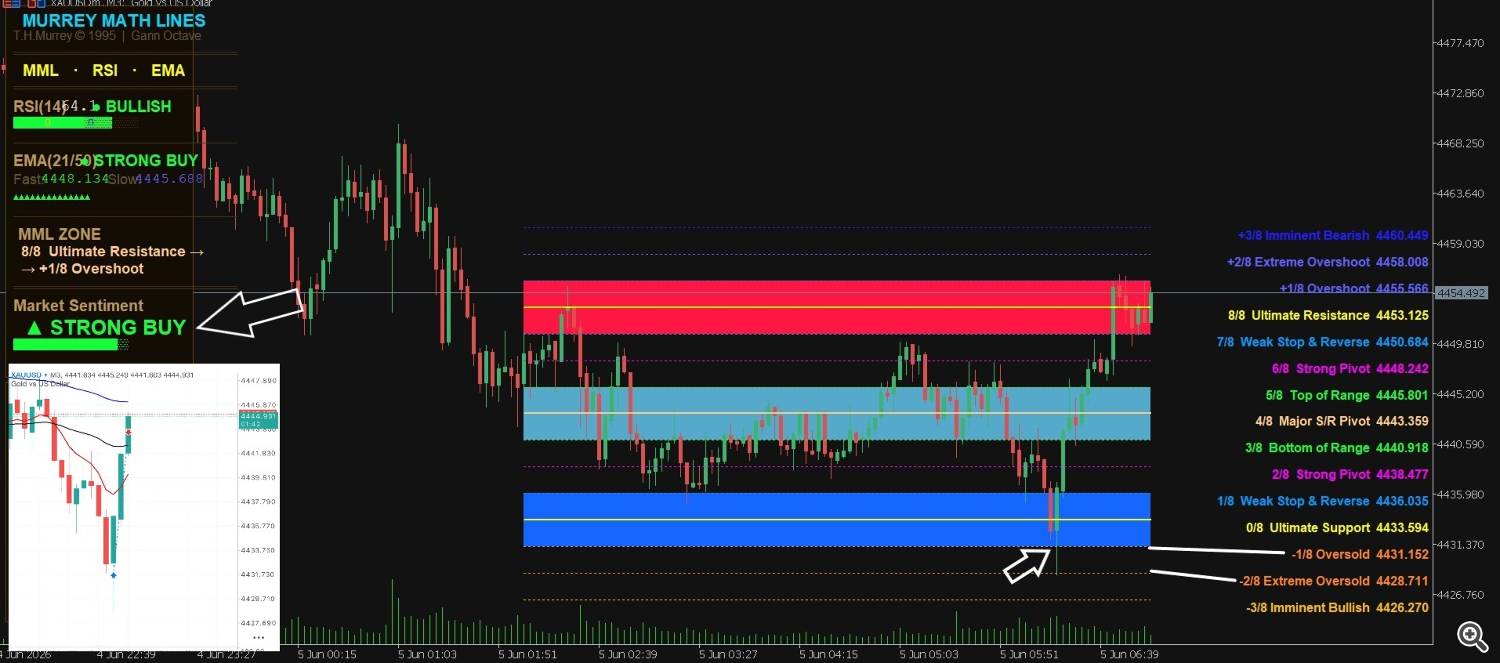
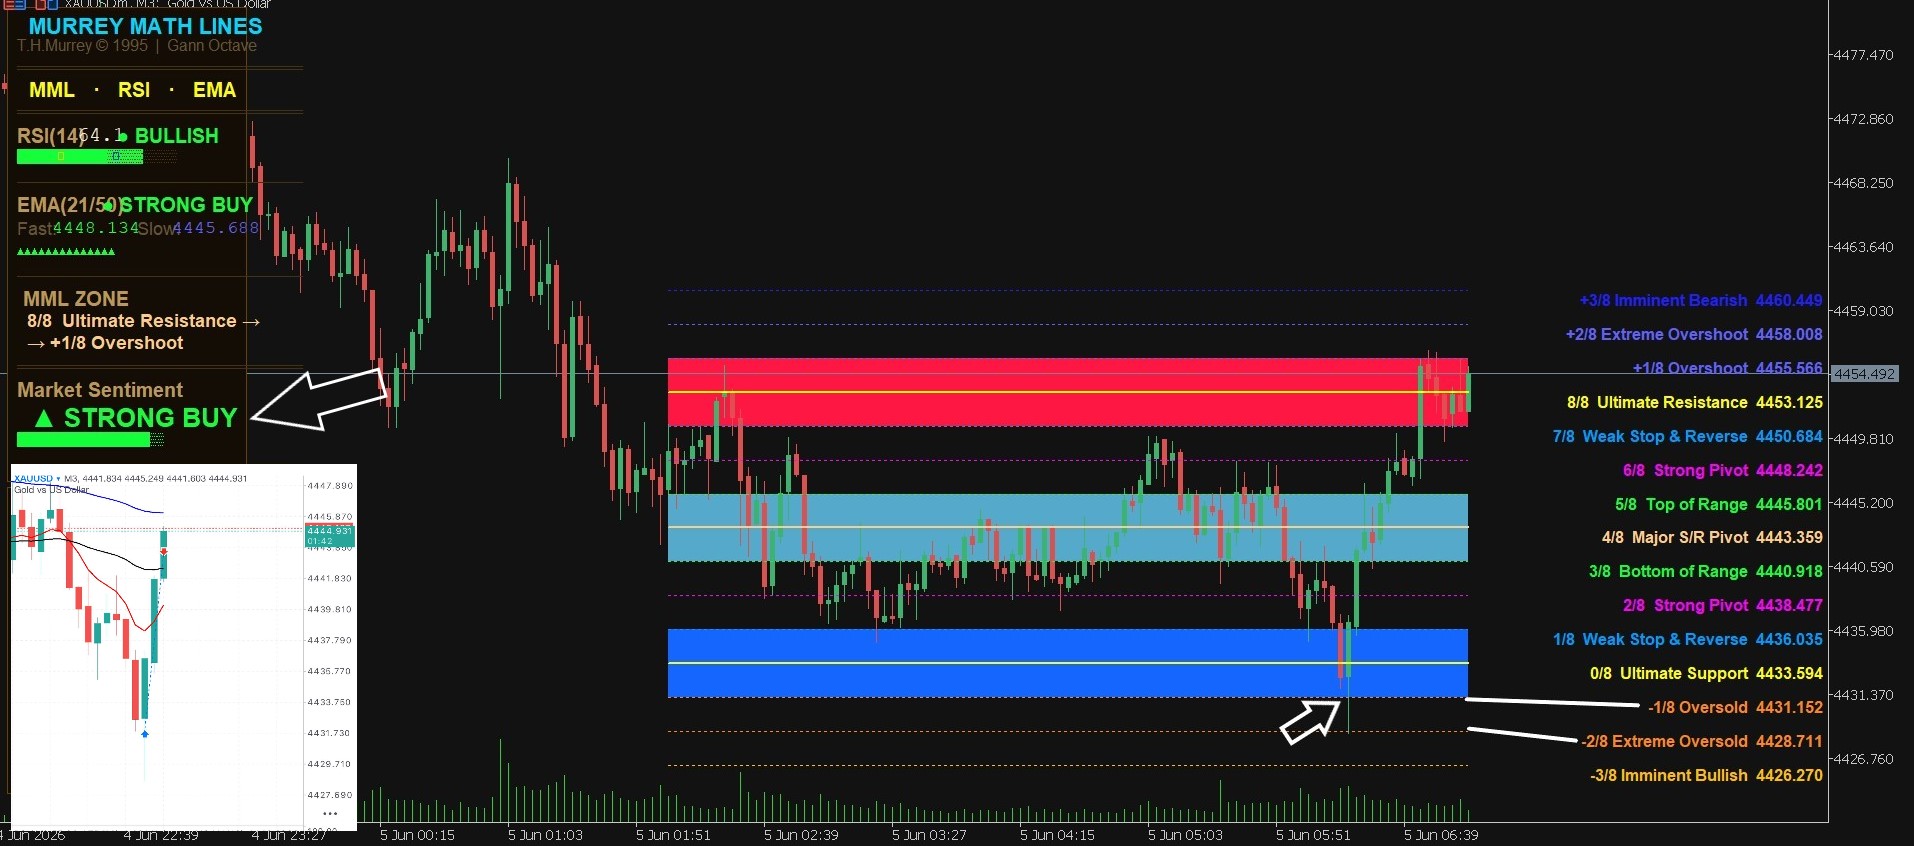
- Screenshot 8 (June 5th): Closed the trading week strong by capturing a classic long (Buy) reversal setup at the [-2/8 and] Extreme Oversold zone, validating the core algorithm parameters.
-


📊 Verification & Account Operations Statement
To supplement these day-to-day tactical setups, the final attachment demonstrates the comprehensive financial metrics, long-term stability, and the overall net yield generated by this strategy:
- Screenshot 9 (Account Operations Log): This verified financial report displays the cumulative trading performance generated by the Murrey Math strategy up until June 2nd, 2026. It includes the combined net profits accumulated from the past trading week as well as previous historical trading cycles. The statement confirms a successfully processed outbound capital transfer from the trading account balance, fully demonstrating the concrete viability, real-world execution, and sustainable growth of the system over an extended period.
📥 Integrate the Mathematics of Price Action
Automating your support and resistance analysis removes emotional bias from your execution, allowing you to trade with institutional-grade geometric levels. You can review the underlying logic, historical backtest results, detailed specifications, and acquire the official tool directly on the MQL5 Market:
🔗 Access the Tool Here: Get Murrey Math Classic Indicator
Feel free to review the attached files below, leave your questions about Murrey line calculations, or share your own trading results in the comments section! Good luck with your trading!
Note: The final statement accurately consolidates the total accumulated net yield processed up until June 2nd, 2026. This comprehensive ledger aggregates the financial performance from both the preceding trading week and earlier operational cycles executed under the Murrey Math architecture, presented using compliant and professional technical terminology.


")
")
