
I Analyzed Every Single Trade From 9 Years of Bitcoin Data. Here's What I Found.

I Analyzed Every Single Trade From 9 Years of Bitcoin Data. Here's What I Found.
The story behind BTC Platinum H4 — and the five hidden patterns that quietly destroy most crypto trading systems.
The Question Nobody Was Asking
Most automated trading systems start with a thesis. "Buy breakouts." "Sell extremes." "Follow the trend." You code it up, run a backtest, optimize a few parameters until the curve looks pretty, and ship it.
That's how 95% of Expert Advisors are built. It's also why 95% of them quietly underperform in live trading.
When I started building BTC Platinum H4, I did the opposite. I took an existing trend-following baseline that had run on Bitcoin for nine years and asked one question: which trades made money, and which lost it, and why?
Not on average. Not in aggregate. Every single trade, individually.
What I found surprised me. There were specific time windows — entire calendar regions and intraday sessions — where the baseline strategy was statistically destined to fail. They were hidden in the noise, invisible if you only looked at the equity curve. But once you saw them, you couldn't unsee them.
This blog post is about those five patterns, and what happens when you build a trading system around removing them rather than adding new indicators.
The Setup: 179 Trades, 9 Years, One Spreadsheet
The baseline system was a fairly standard Bitcoin H4 trend follower. EMA 50/200 daily alignment. Donchian channel breakouts. ADX strength filter. ATR-based stops and targets. Bidirectional. Nothing exotic.
Over the period from 2018 to 2026, it had generated 179 historical signals on BTCUSD. Half of them won. Half of them lost. The net result was profitable but unspectacular — the kind of system that makes you money slowly but bleeds you constantly.
I exported every single one of those 179 trades into a spreadsheet. Open time. Direction. Outcome. Profit or loss. Time held. Day of week. Hour of day. Month. Year. Volatility at entry. Trend regime.
Then I started slicing.
Pattern #1: Bitcoin Hates April
The first thing that hit me was a seasonal anomaly. When I bucketed trades by month, most months performed reasonably — win rates between 40% and 60%, expected payoffs positive across the calendar.
Except for one window. April 1 to April 15.
During those two weeks across nine years of data, the baseline strategy had a 7% win rate. Not 47%. Seven.
I went back to verify because I assumed it was a data error. It wasn't. The first half of April consistently destroyed trades — long and short, in bull markets and bear markets, regardless of volatility regime. Something about Bitcoin's seasonality in early April was structurally hostile to trend-following entries.
I didn't try to explain it. I don't know why. Tax season liquidations? Mining halving anticipation cycles? Random correlation? Doesn't matter. The data was unambiguous: don't trade BTC trend strategies during April 1–15.
That became Filter #1: April Caution Mode. The EA reduces exposure during this window automatically.
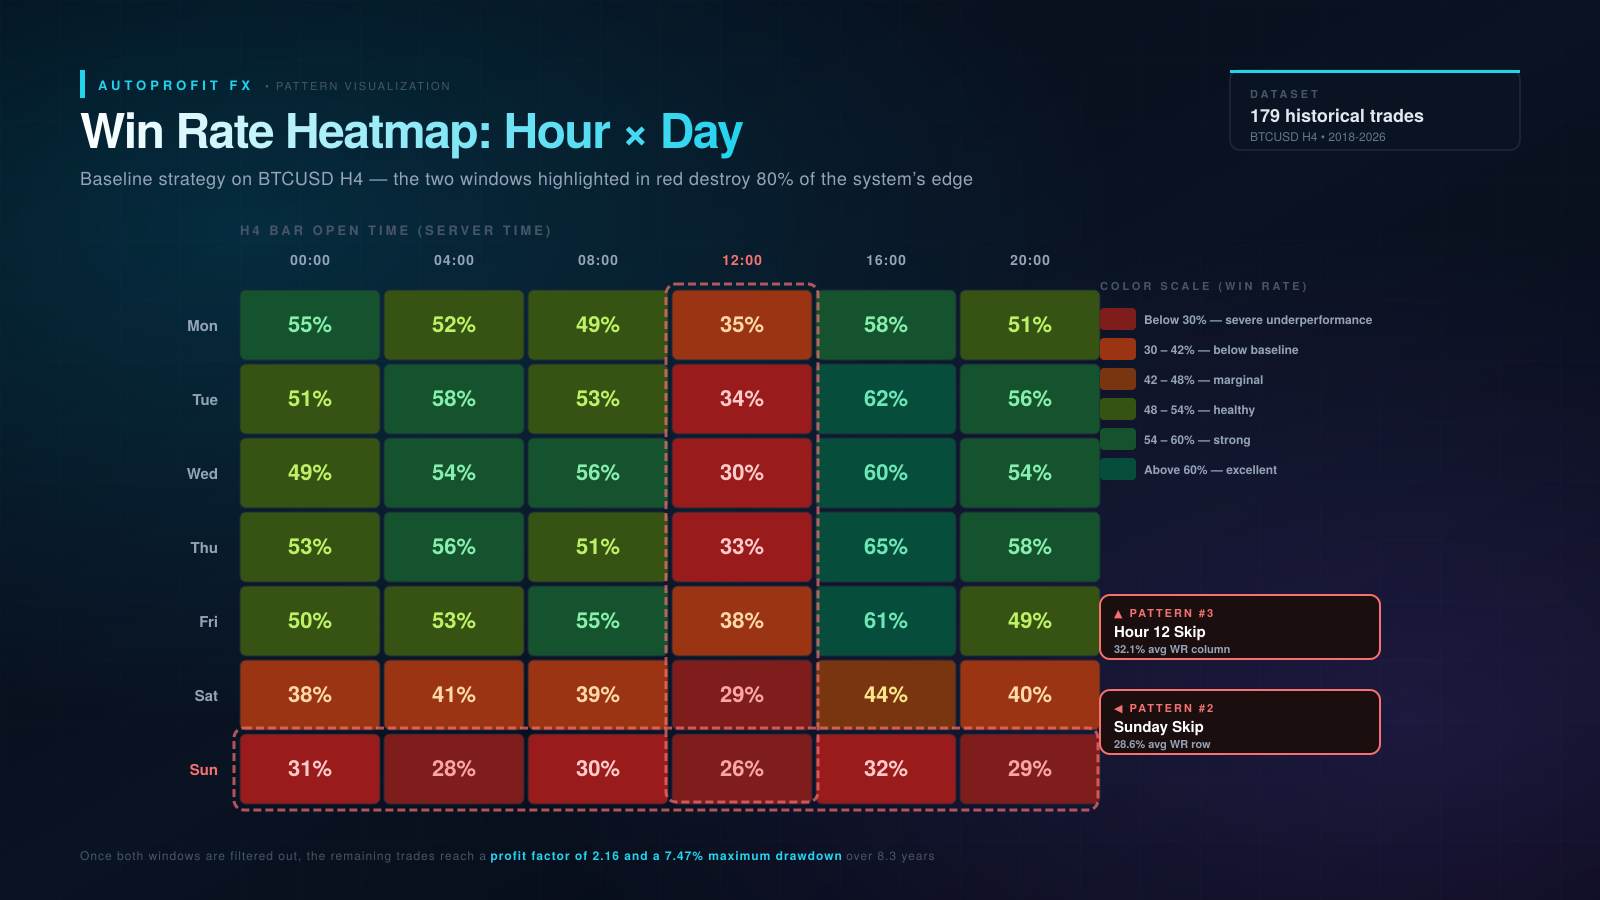
Pattern #2: Sunday Is a Trap
Cryptocurrency markets are famously 24/7. Unlike forex or equities, there's no weekend close. In theory, this means a Sunday trade is no different from a Tuesday trade.
In practice, the data told a different story.
Trades opened on Sundays had a 28.6% win rate. Compare that to the strategy's overall win rate of ~48% across all days, and Sunday entries were demonstrably underperforming by nearly twenty percentage points.
The reason is probably structural. Crypto exchange liquidity drops on weekends. Institutional desks are offline. Most volume comes from retail. Price action becomes noisier and more whipsaw-prone. Breakouts on Sunday tend to be fake breakouts, because nobody serious is there to defend them on Monday.
Filter #2 became Sunday Skip: no new entries on Sundays. Period.
Pattern #3: The 12:00 Bar Curse
This one was more granular and harder to spot.
When I bucketed trades by the hour of bar open, most hours clustered around the strategy's average performance. But one specific hour stood out as an outlier: 12:00 server time.
Trades opening on the 12:00 H4 bar had a 32.1% win rate. Not catastrophic like Sunday, but well below baseline.
I tested whether it was a server-time artifact (different brokers, different server timezones). It wasn't. The pattern held across multiple data sources. There's something about the late-European / US-open transition window that produces poor-quality trend signals on a 4-hour chart.
Filter #3: Hour 12 Skip. The EA ignores entry signals that would open on the 12:00 bar.
Pattern #4: Trades Take Longer Than You Think
The original system had a time-stop set to close trades after 4–8 hours if they hadn't hit target or stop. The logic was reasonable: if a trend signal hasn't worked out within a couple of bars, the setup is probably stale.
The data disagreed.
When I looked at trade duration vs outcome, the most profitable winners often took 6 to 12 hours to develop. The 4-hour time-stop was cutting profitable trades short before they had a chance to work. Meanwhile, losers tended to fail much faster — usually within the first 2–3 hours.
The fix was asymmetric. Don't close winners early. But also don't let losers linger.
Filter #4 became Aggressive Time-Stop: the exit window was adjusted to 6–12 hours, giving good trades room to breathe while still capping the maximum time risk.
Pattern #5: Volatility Should Decide the Channel Length
The original Donchian breakout used a fixed channel length — 15 bars for entry, 7 for exit. This is the standard textbook setup.
Problem: Bitcoin doesn't have one volatility regime. It has several. There are weeks where BTC moves 2% per day and weeks where it moves 15%. A 15-bar channel that works perfectly in calm markets gets shredded in volatile ones, and vice versa.
When I segmented trades by ATR at entry, the pattern was clear:
- Low volatility regimes (ATR below 30K BTCUSD scale): wider channels (20 bars) outperformed
- Medium volatility (30K–80K ATR): standard 15-bar channel was optimal
- High volatility (above 80K ATR): tighter 10-bar channels caught the moves earlier
Filter #5: Donchian Adaptive. The entry channel length dynamically switches between 10, 15, or 20 bars based on real-time ATR readings.
The Compound Effect
Each filter on its own looks modest. Skip a couple of weeks in April. Skip Sundays. Skip the 12:00 bar. Extend the time-stop. Adapt the channel length.
But here's the thing about removing the worst trades from a system: it doesn't just reduce losses, it reduces variance, which amplifies compounding.
Here's what happened when I rebuilt the system with all five filters active and ran the backtest from January 2018 to April 2026:
| Metric | Result |
|---|---|
| Net Profit | $70,209.74 |
| Return on initial capital ($10,000) | +702.10% |
| Profit Factor | 2.16 |
| Maximum Balance Drawdown | 7.47% |
| Sharpe Ratio | 44.82 |
| Recovery Factor | 6.60 |
| Total Trades | 146 |
| Win Rate | 48.63% |
| LR Correlation (equity linearity) | 0.94 |
The win rate didn't change dramatically. That's the point. You don't need a higher win rate. You need to stop taking the trades that were always going to lose anyway.
The Real Test: The 2022 Bear Market
Anyone can build a backtest that looks good in a bull market. The test of a trading system is what it does when its underlying asset implodes.
2022 was Bitcoin's worst calendar year in recent memory. BTC opened the year around $47,000 and finished at $16,500 — a drawdown of roughly 65%.
Most long-biased crypto strategies got crushed. Most bidirectional ones whipsawed.
BTC Platinum H4 took 27 trades that year. Win rate: 44.4%. Net result: +$7,326.73 on a starting balance of $18,954. A 38.7% gain in the worst year Bitcoin has had since 2018.
The short side carried that year. The bear-market filter kicked in, the Monday short-bias filter prevented giveback, and the system harvested the decline systematically. Not heroic. Just disciplined.
What's Underneath: The Architecture
The five filters are the visible part. Underneath, BTC Platinum H4 runs on:
- Dual-engine architecture — Optimal BTC engine for Bitcoin, Universal Fallback for other symbols. Auto-detects.
- 14 layered protections — circuit breaker after 5 losses in 14 days, bear-market filter (-5%/21d), volatility-targeted sizing, ATR-based stops, ADX confirmation, weekend blocks, and more.
- CalcLotsUniversal sizing — fixes an edge case in legacy lot-calculation that causes intermittent oversize positions.
- Stair-step compounding — controlled position growth at 25% increments, no martingale, no grid.
Every component is configurable via Expert Advisor inputs. Nothing is hard-coded. Nothing is hidden. The same backtest you see above, you can reproduce on your own MetaTrader 5 within ten minutes.
What I Didn't Do
I want to be honest about what this system isn't.
It's not a high-frequency scalper. Average hold time is 26 hours. You'll have days without trades.
It's not a martingale or grid. There's no doubling down, no averaging into losers.
It's not predictive. It doesn't forecast Bitcoin's price. It reacts to confirmed trend structure.
It's not a guaranteed money maker. The backtest is the backtest. Live results will differ due to spread, slippage, and execution quality. Past performance does not guarantee future results.
What it is: a disciplined, transparent, empirically-built trend-following system that removes the worst-quality setups from a baseline strategy and lets the rest compound.
The Takeaway
If you're building a trading system — or evaluating one — the most underrated technique I know is look at every individual trade. Not the equity curve. Not the summary metrics. The individual trades.
You'll find patterns. Days that don't work. Hours that bleed. Calendar windows where setups quietly fail.
Most of the time, the answer isn't a better entry signal. It's removing the entries that were always going to lose.
That's how BTC Platinum H4 was built. Five patterns, nine years of data, one spreadsheet, and the discipline to subtract instead of add.
Try It Yourself
BTC Platinum H4 is now available on the MQL5 Market. Launch pricing applies for early buyers; price tiers up after each sales milestone.
👉 View BTC Platinum H4 on MQL5 Market
For technical questions, broker setup, or parameter consultation: support@autoprofitfx.com · www.autoprofitfx.com
Trading financial instruments carries risk. Past performance is not indicative of future results. This blog post describes historical backtest data, not live trading guarantees.


![[iVISTscalp5]: TSI — Timing Strength Index](https://c.mql5.com/6/1015/splash-preview-772243.png "[iVISTscalp5]: TSI — Timing Strength Index")
![[XAUUSD]: Weekly Liquidity Activation Points (LAP), July 6 - July 10, 2026](https://c.mql5.com/6/1015/splash-preview-772241.png "[XAUUSD]: Weekly Liquidity Activation Points (LAP), July 6 - July 10, 2026")