


Stay Connected
Join MQL5 Channel 👉 https://www.mql5.com/en/channels/issam_kassas
Must-Read PSTS Guide 👉 https://www.mql5.com/en/blogs/post/766038
Free Online Course 👉 https://www.mql5.com/en/blogs/post/766525
Free Pro Trading Ebook 👉 https://www.mql5.com/en/blogs/post/766038
Support and Resistance Levels Finder — Multi-Timeframe Precision
The Support and Resistance Levels Finder is designed for traders who rely on structure, reaction zones, and clean multi-timeframe levels.
It automatically identifies key support and resistance zones and updates them dynamically as new market structures form.
This tool simplifies chart analysis, improves timing, and provides a clear framework for planning entries, exits, and risk placement.
How to Download, Set Up, and Use
-
Install the indicator in your terminal.
-
Attach it to any chart and select the timeframes you want to display.
-
The indicator will automatically plot the most accurate support and resistance levels based on its internal multi-parameter algorithm.
-
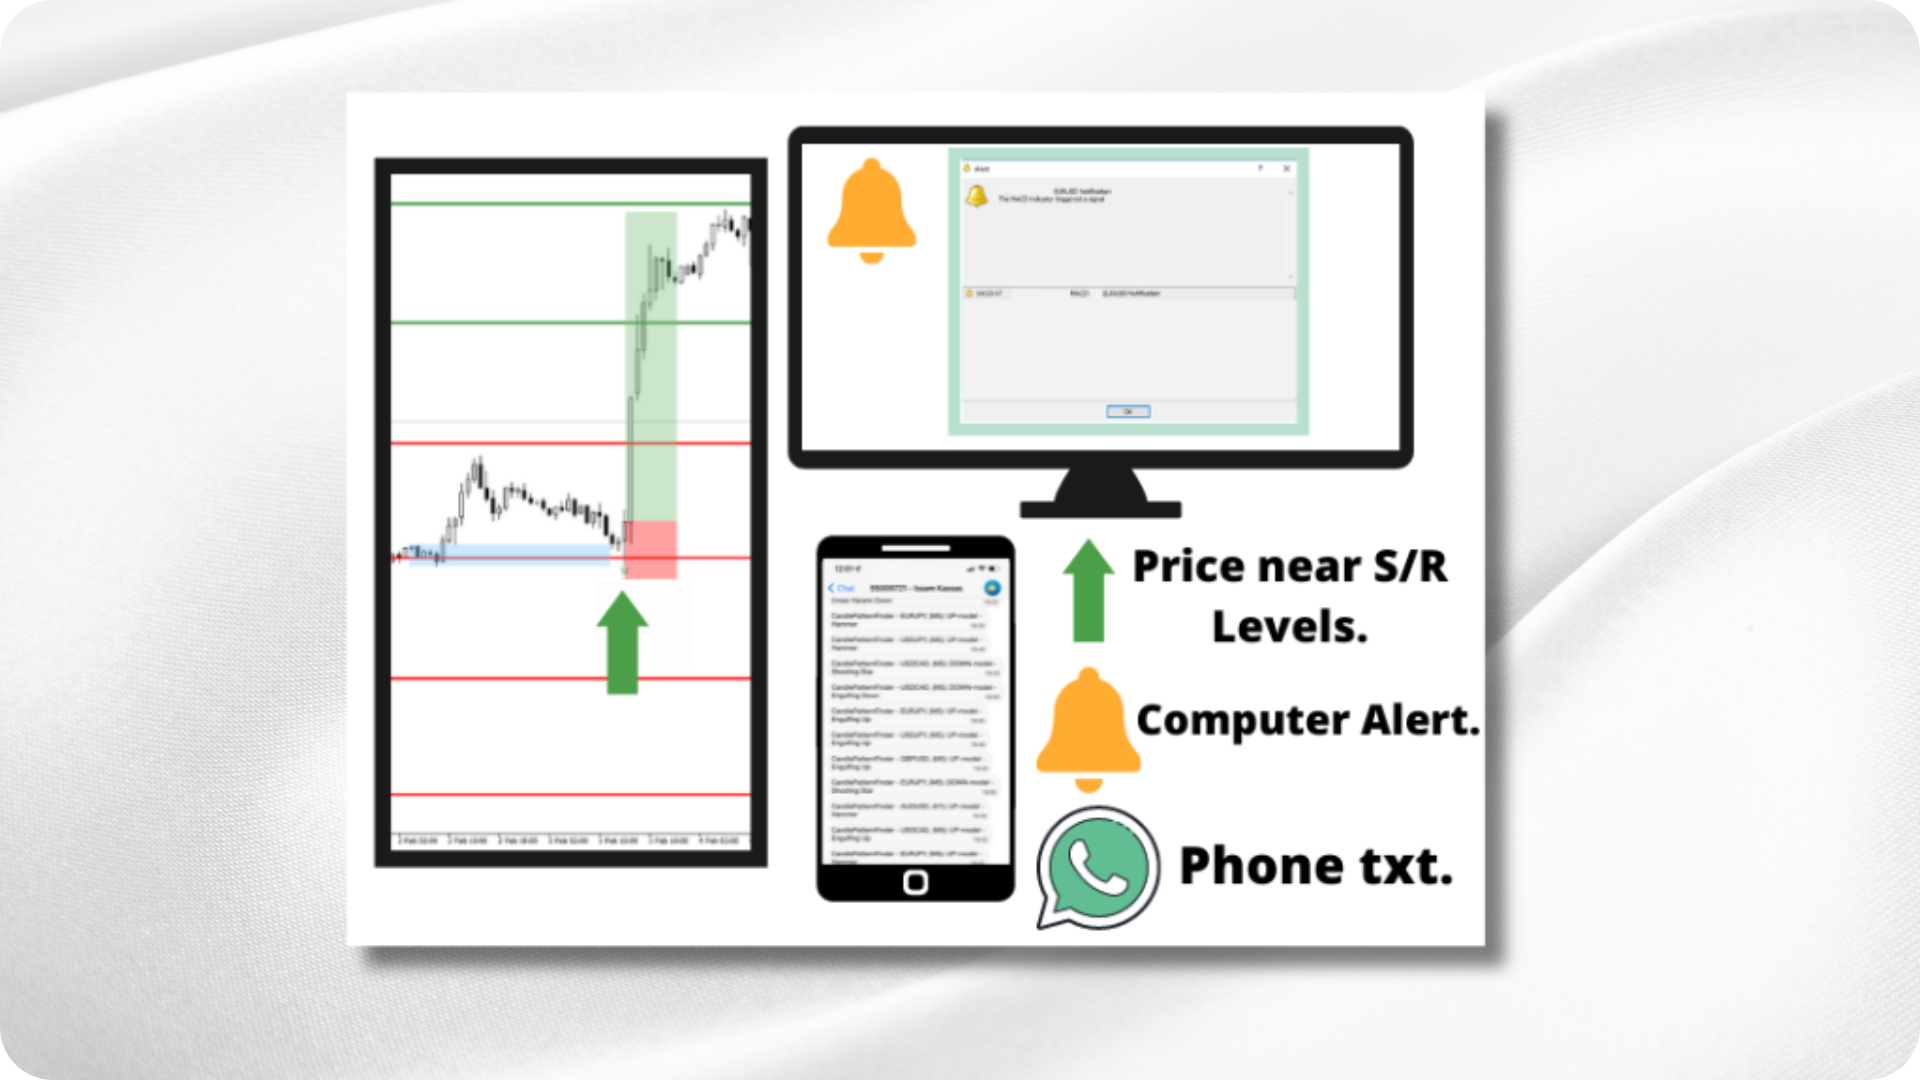
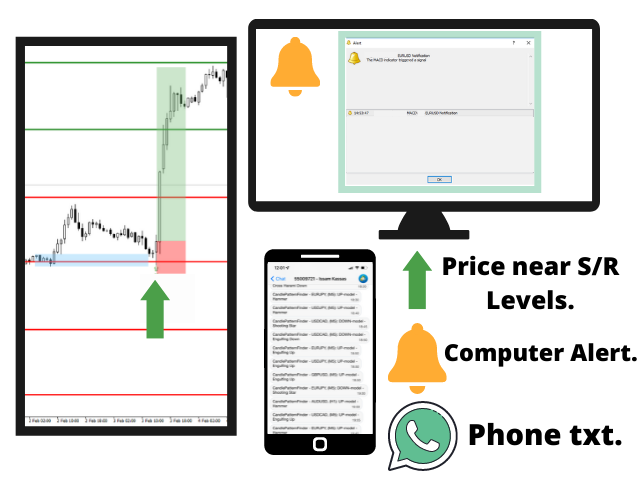
Enable alerts if you want notifications when price approaches critical areas.
-
Use the hide/show button or hotkey to toggle the levels on demand.
The Logic Behind the Indicator
This tool goes beyond basic fractal-style S&R indicators.
It uses a smart algorithm that evaluates historical data with multi-parameter calculations to detect only meaningful levels — not noise.
The real strength lies in its multi-timeframe capability, allowing traders to overlay higher-timeframe levels (H1, H4, Daily, Weekly) on any chart, even as low as M5.
This creates a structured map of the market where key reactions are most likely to occur.
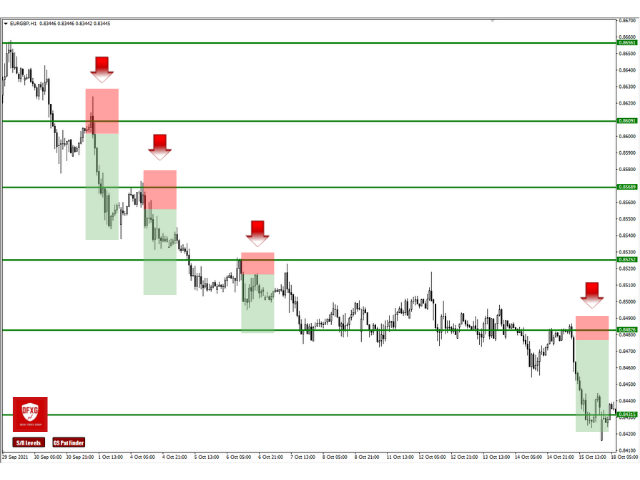
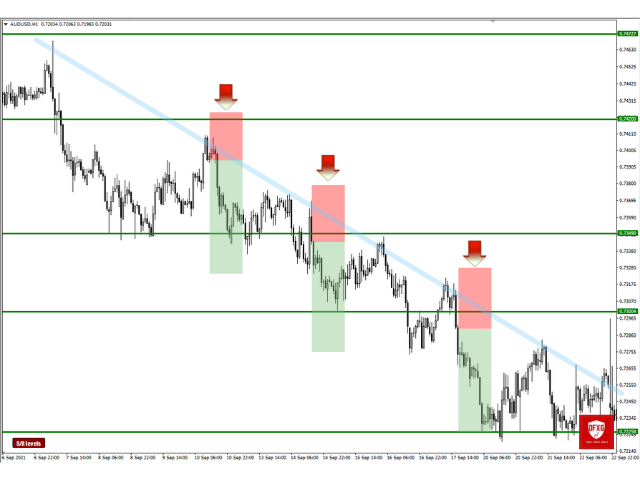
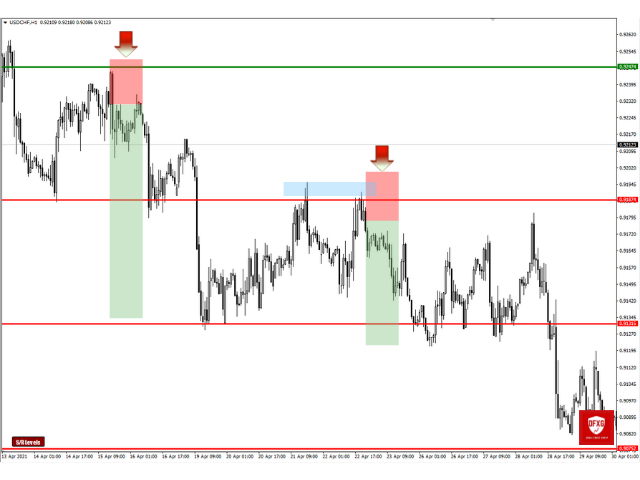
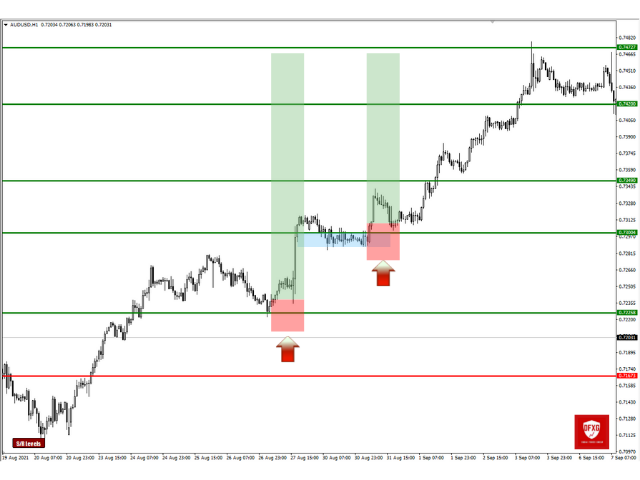
What You Will See on the Chart
The indicator automatically displays:
-
Dynamic support levels
-
Dynamic resistance levels
-
Higher-timeframe levels over lower-timeframe charts
-
Key historical levels recalculated in real-time
-
Optional alerts when price approaches a major level
These features allow traders to spot where liquidity sits, where price may reverse, where breakouts matter, and where risk should be managed.
Key Features
Dynamic Level Detection
Support and resistance levels update continuously as new structure forms, keeping your chart aligned with real-time price action.
Multi-Timeframe Overlays
Display levels from any timeframe onto any chart.
For example: daily levels on a 5-minute chart — a major advantage for intraday traders.
Smart Algorithm
Uses historical data and multi-parameter calculations for high accuracy, avoiding false or weak levels.
Fully Customizable
Set unique colors for support and resistance zones so you can visually separate different timeframe levels.
Alerts for Critical Zones
Receive notifications when price approaches an important level, helping you prepare for entries or risk adjustments.
Quick Visibility Controls
Includes a panel button and hotkey to hide or show all levels instantly, keeping your chart clean whenever needed.
Why Traders Use This Tool
Strong support and resistance levels are the backbone of market structure.
This indicator allows traders to:
-
Identify reliable reaction zones
-
Avoid false breakouts
-
Time entries with greater precision
-
Align trades with higher-timeframe structure
-
Spot key levels without manual drawing
-
Improve stop-loss and take-profit placement
Whether you trade breakouts, reversals, trend-following, or scalping, clean levels enhance every strategy.
Professional Usage Tips
-
Always check higher-timeframe levels before entering trades.
-
Combine levels with trend direction for stronger probability.
-
Use alerts to anticipate tests of major zones.
-
Hide levels during volatile sessions to reduce noise.
-
Confirm levels with candle closes and structure shifts.
Final Thoughts
The Support and Resistance Levels Finder provides a structured, accurate, and highly flexible method for identifying key price levels.
Its multi-timeframe analysis, dynamic updates, and professional-grade algorithm make it suitable for traders at all levels.
It replaces manual drawing with objective, rule-based structure — giving traders clearer vision and stronger decision-making.
Disclaimer
Trading in financial markets carries significant risk.
Tools and indicators — including the Support and Resistance Levels Finder — do not guarantee profits or protect against losses.
Test thoroughly on a demo account and always apply proper risk management.


