Issam Kassas / Profile
- Information
|
4 years
experience
|
36
products
|
1246
demo versions
|
|
0
jobs
|
0
signals
|
0
subscribers
|
I’m Issam Kassas, the developer behind Issam Algo. I build MetaTrader 5 indicators and Expert Advisors for chart analysis and trading automation.
Current OFFER: Buy Smart Trend Trading System MT5 and receive Smart Universal Expert Adviser MT5 as a free bonus.
Smart Trend Trading System MT5:
https://www.mql5.com/en/market/product/103515
Smart Universal Expert Adviser MT5:
https://www.mql5.com/en/market/product/104039
After purchasing Smart Trend Trading System, message me here on MQL5 to claim your bonus.
For product questions, setup guidance, or technical support, contact me directly through MQL5 messages.
Current OFFER: Buy Smart Trend Trading System MT5 and receive Smart Universal Expert Adviser MT5 as a free bonus.
Smart Trend Trading System MT5:
https://www.mql5.com/en/market/product/103515
Smart Universal Expert Adviser MT5:
https://www.mql5.com/en/market/product/104039
After purchasing Smart Trend Trading System, message me here on MQL5 to claim your bonus.
For product questions, setup guidance, or technical support, contact me directly through MQL5 messages.
Issam Kassas
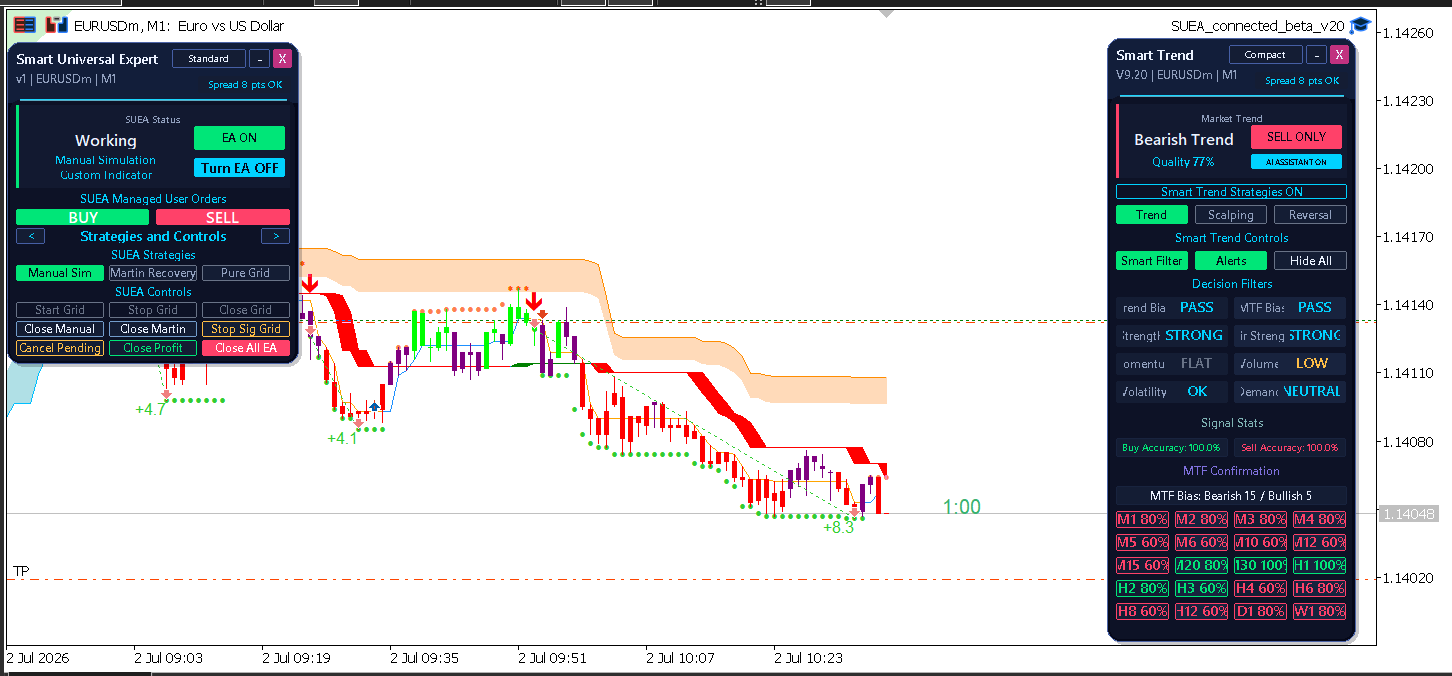
Check the operating mode as well as the signal. This historical EURUSDm M1 chart from 2 July 2026 shows Smart Trend with Bearish Trend and SELL ONLY, while momentum is FLAT and volume LOW. The Smart Universal Expert panel is labelled Manual Simulation. Compare the filters with price structure and verify the execution mode before using a setup. Displayed accuracy and pip figures are interface statistics, not verified live results or guaranteed returns. Test settings on demo first.
https://www.mql5.com/en/market/product/103515
Issam Kassas
Read the warning as well as the direction. This historical June 2026 BTCUSDm M5 example shows Atomic Analyst with BUY ONLY, but also Warning: Spread Risk. Momentum reads WEAK SELL, and the Active Signal Ticket shows SELL despite the bullish headline. Check the ticket time, timeframe and current price structure before interpreting a setup. Displayed confidence and chart figures are interface readings, not verified live results or guaranteed returns. Test settings on demo first.
https://www.mql5.com/en/market/product/114662
Issam Kassas
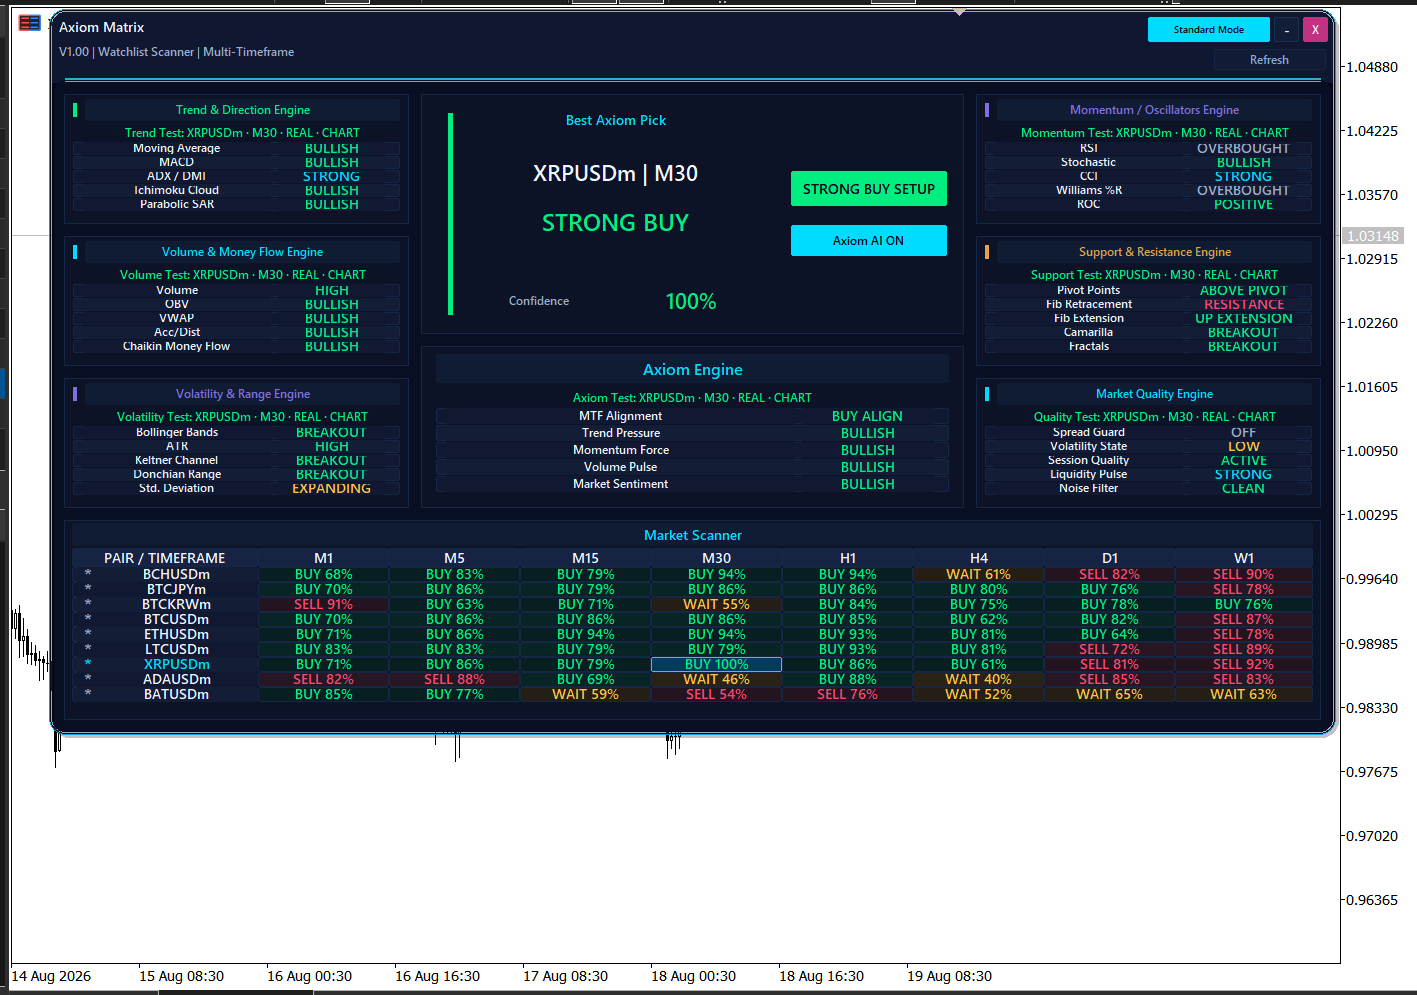
Check the timeframe before interpreting a scanner pick. This historical August 2026 Axiom Matrix dashboard highlights XRPUSDm M30 as STRONG BUY, while its D1 and W1 cells show SELL. RSI and Williams %R read OVERBOUGHT despite bullish trend readings. Compare those differences with price structure and your chosen horizon. The displayed 100% confidence is a dashboard score, not a guaranteed probability of profit. Test settings on demo first.
https://www.mql5.com/en/market/product/182954
Issam Kassas
Timeframes can disagree. This historical BTCUSDm M5 chart from 14–15 September 2026 shows UNIX Scalper with SELL readings on M1, M2, M3, M5 and M15, while M10 reads BUY. Compare each timeframe with its own price structure and the marked Entry, Stop Loss, TP1 and TP2 levels before interpreting a setup. The performance curve is labelled SIMULATION P/L; it is not a verified live account result. Quality percentages and historical figures do not guarantee future returns. Test settings on demo first.
https://www.mql5.com/en/market/product/190882
Issam Kassas
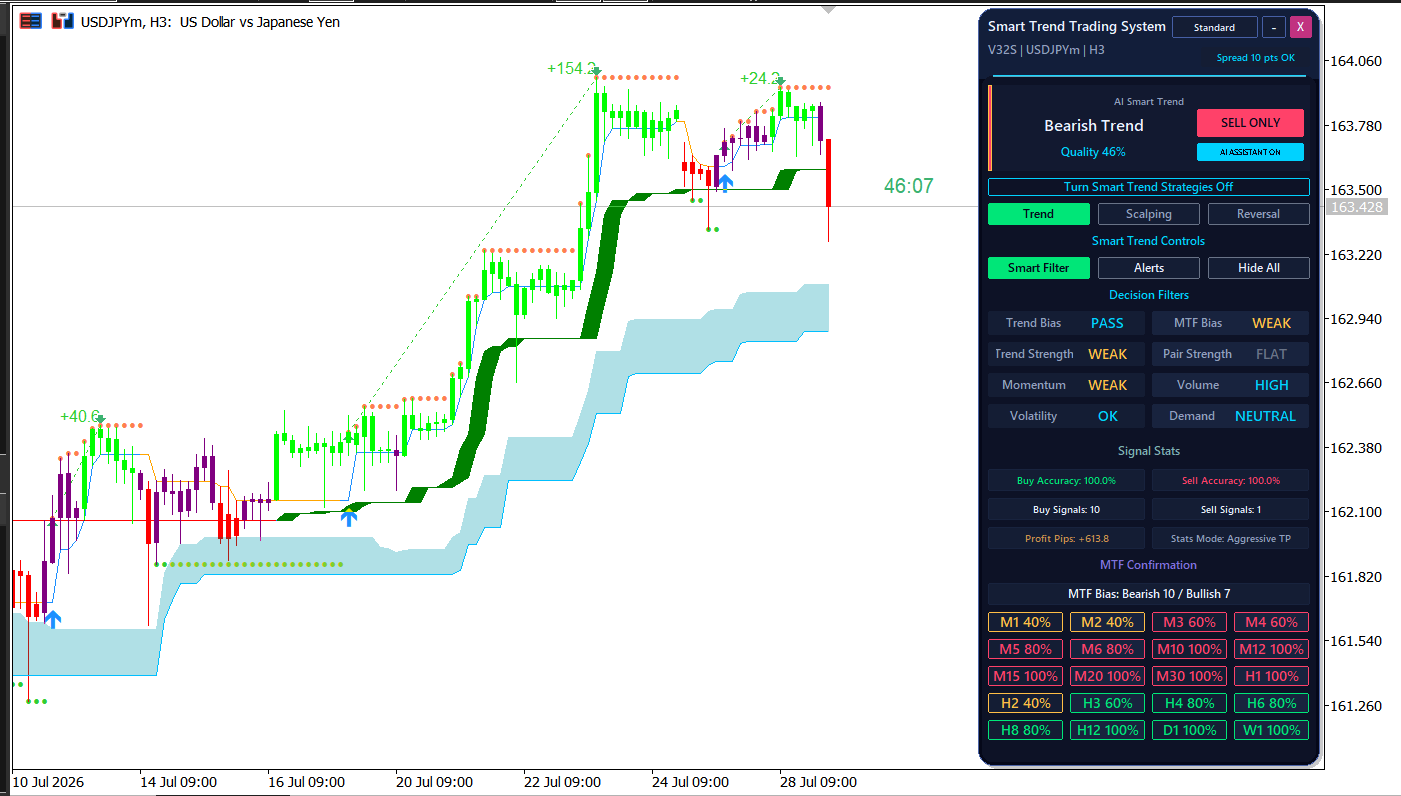
A directional label needs context. This historical USDJPYm H3 chart from July 2026 shows Smart Trend Trading System with Bearish Trend and SELL ONLY after a rising price sequence. Trend strength, momentum and MTF bias read WEAK, while volume is HIGH and pair strength FLAT. Compare these readings with the latest candle and price structure before interpreting a signal. Displayed accuracy and pip figures are interface statistics, not verified live results or guaranteed returns. Test settings on demo first.
https://www.mql5.com/en/market/product/103515
Issam Kassas
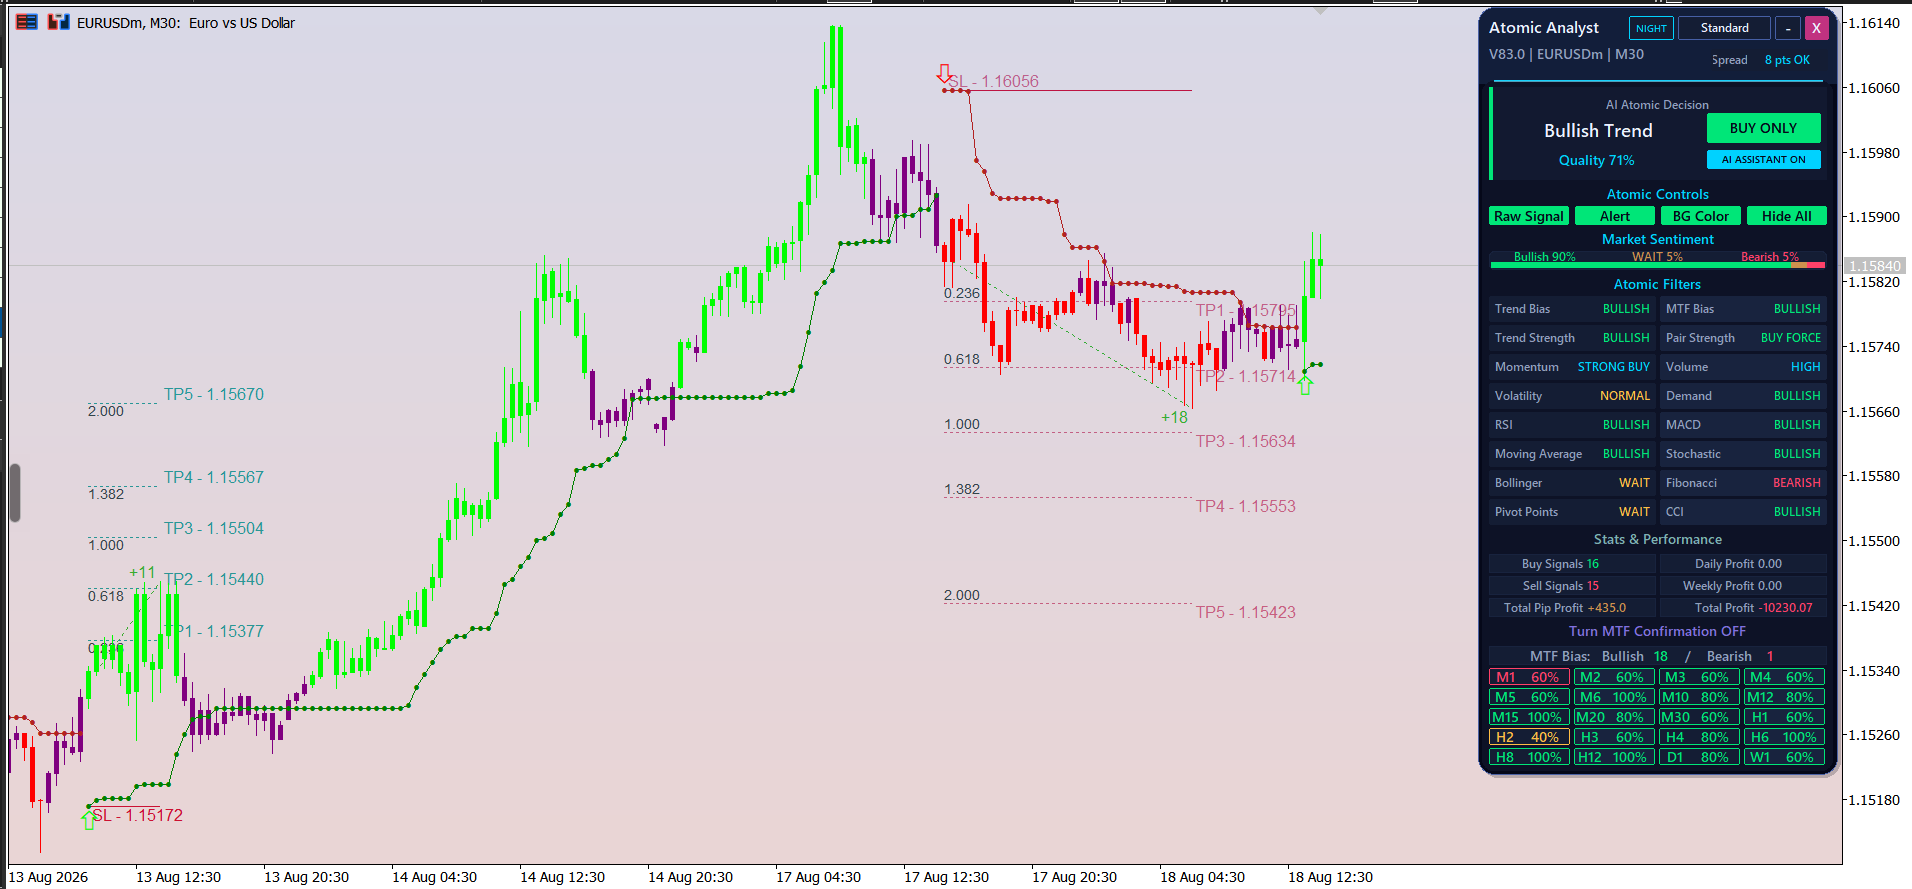
Read the exceptions as well as the headline. This historical EURUSDm M30 chart from August 2026 shows Atomic Analyst with Bullish Trend and BUY ONLY, supported by STRONG BUY momentum and HIGH volume. Yet Fibonacci reads BEARISH, while Bollinger and Pivot Points show WAIT. Compare the filters with price structure and the marked Stop Loss and Take Profit levels before interpreting a signal. Displayed percentages and profit figures are interface statistics, not verified live results or guaranteed returns. Test settings on demo first.
https://www.mql5.com/en/market/product/114662
Issam Kassas
Trend direction and momentum describe different parts of a setup. This historical XAUUSDm H1 chart from August 2026 shows Smart Trend with Bullish Trend and BUY ONLY, while momentum reads WEAK and volume NORMAL. The timeframe panel also contains mixed readings. Compare those filters with price structure before interpreting an arrow. Displayed quality, accuracy and pip figures are interface statistics, not verified live results or guaranteed returns. Test settings on demo first.
https://www.mql5.com/en/market/product/103515
Issam Kassas
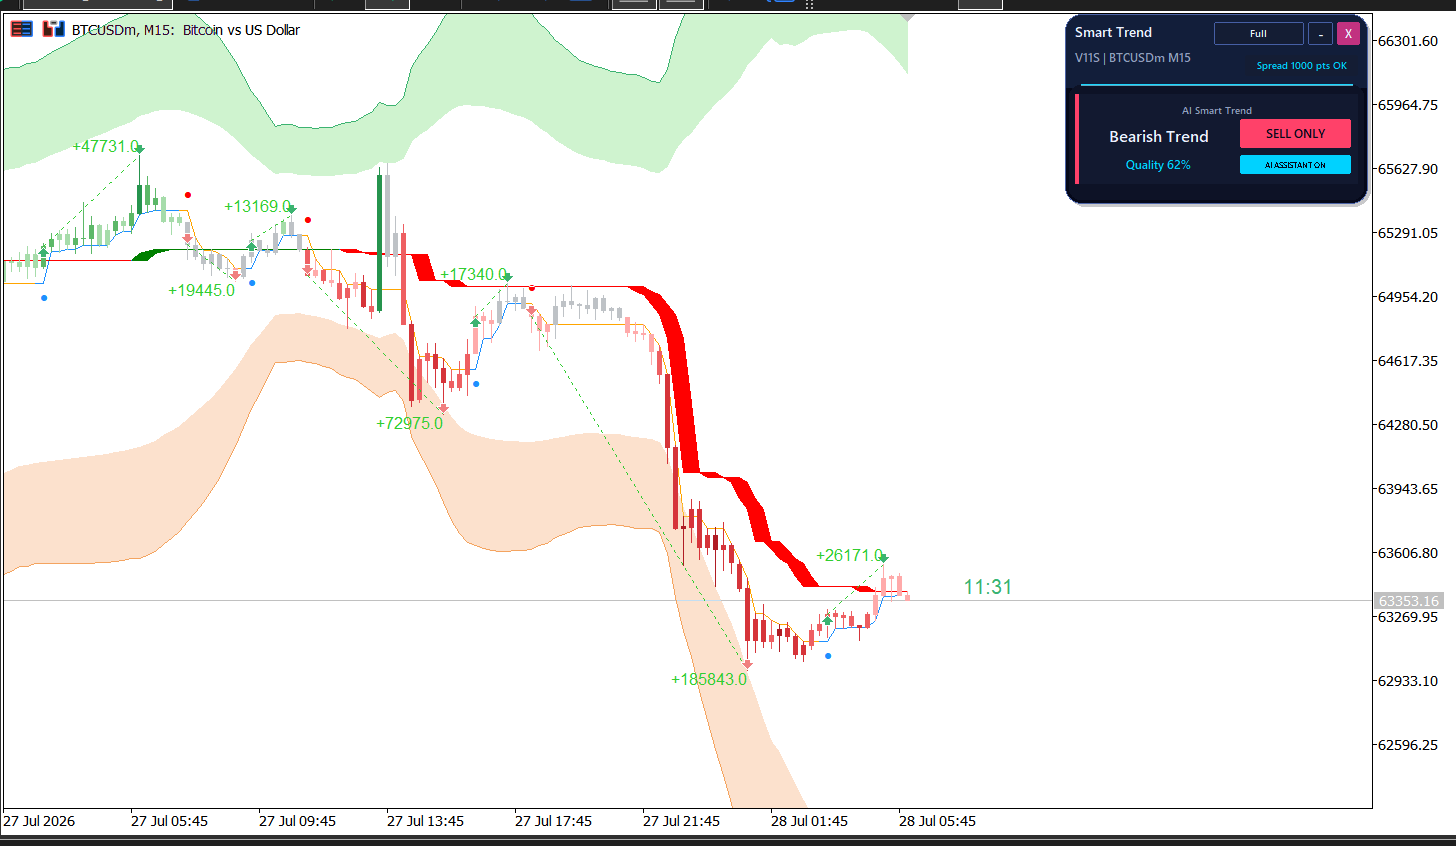
A bearish label does not remove retracement risk. This historical BTCUSDm M15 chart from 27–28 July 2026 shows Smart Trend V11S with Bearish Trend and SELL ONLY, while price rebounds after a sharp decline. Compare the trend line, recent swing structure and your planned exit before interpreting a signal. The displayed quality percentage and pip annotations are interface figures, not verified live results or guaranteed returns. Test settings on demo first.
https://www.mql5.com/en/market/product/103515
Issam Kassas
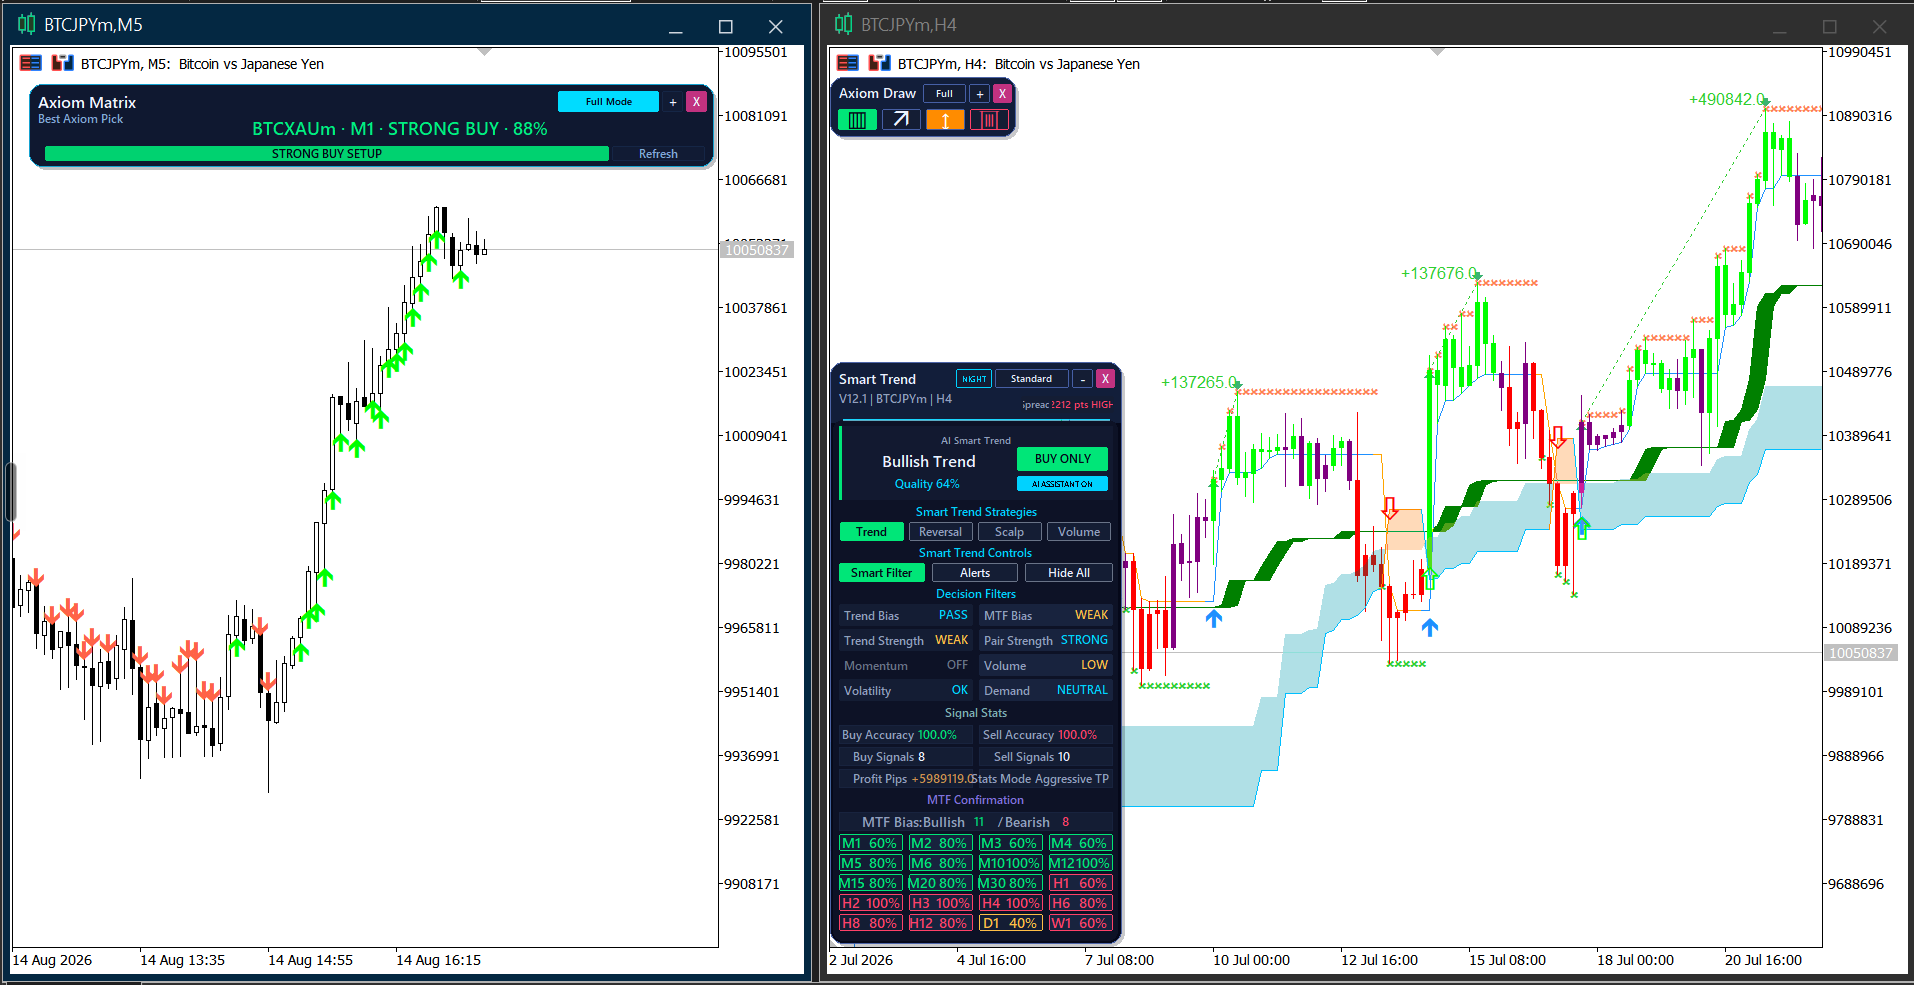
Check the symbol, timeframe and date before comparing signals. This historical split view shows BTCJPYm M5 in August 2026 beside BTCJPYm H4 in July. The Axiom Matrix pick is a different market, BTCXAUm M1, so it should not be read as the BTCJPYm chart signal. On the H4 Smart Trend panel, Bullish Trend and BUY ONLY appear alongside WEAK trend strength and LOW volume. Read supporting filters together with price structure. Displayed percentages and pip statistics are interface figures, not verified live results or guaranteed returns. Test settings on demo first.
https://www.mql5.com/en/market/product/103515
Issam Kassas
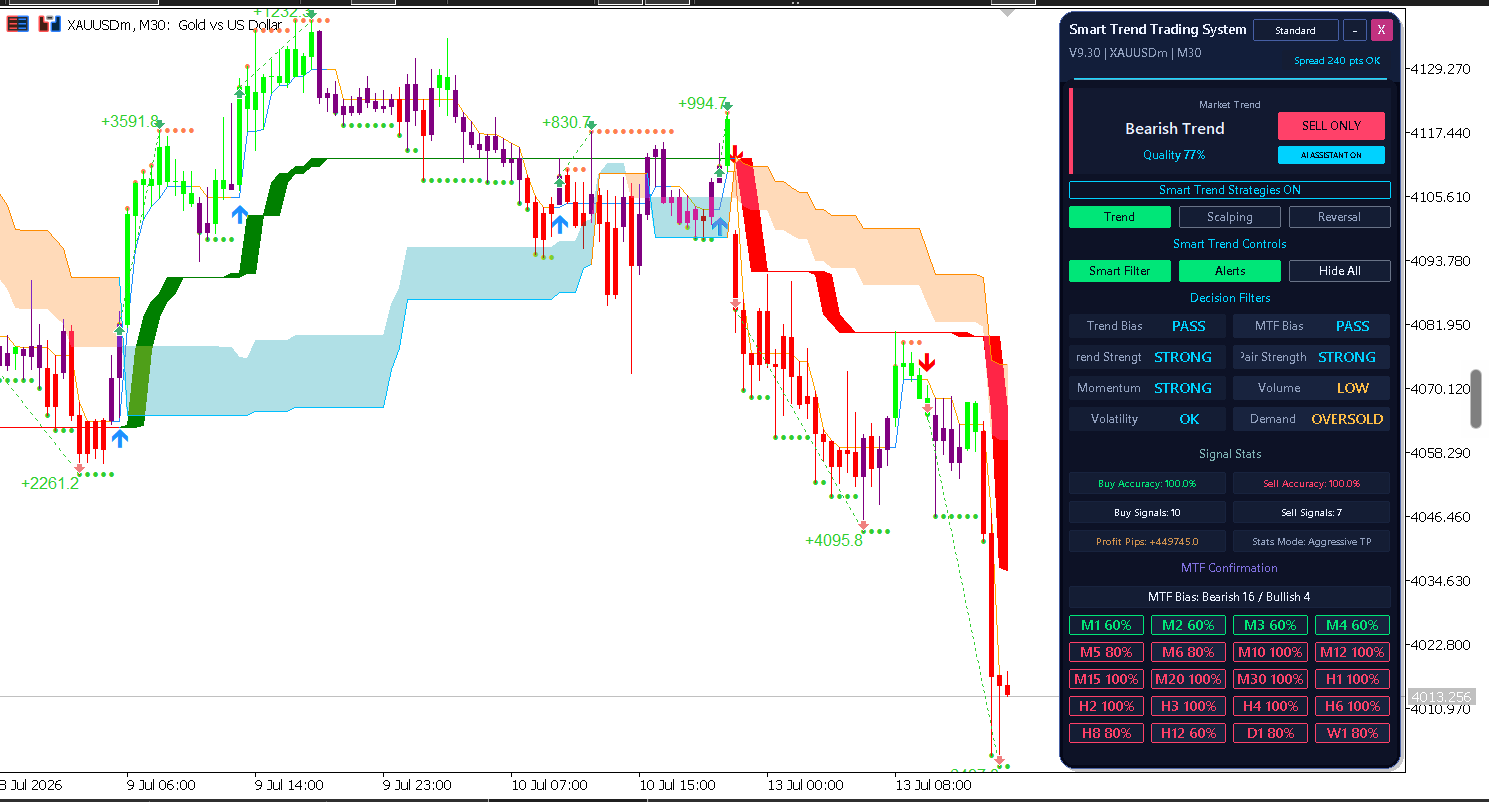
Trend direction is only one part of a setup. This historical July 2026 XAUUSDm M30 chart shows Smart Trend Trading System with Bearish Trend and SELL ONLY, while momentum is STRONG, volume LOW and demand OVERSOLD. Compare those readings with price structure before interpreting a signal: a directional label does not remove the possibility of a retracement. Displayed accuracy and pip statistics are interface figures, not verified live results or guaranteed returns. Test settings on demo first.
https://www.mql5.com/en/market/product/103515
Issam Kassas
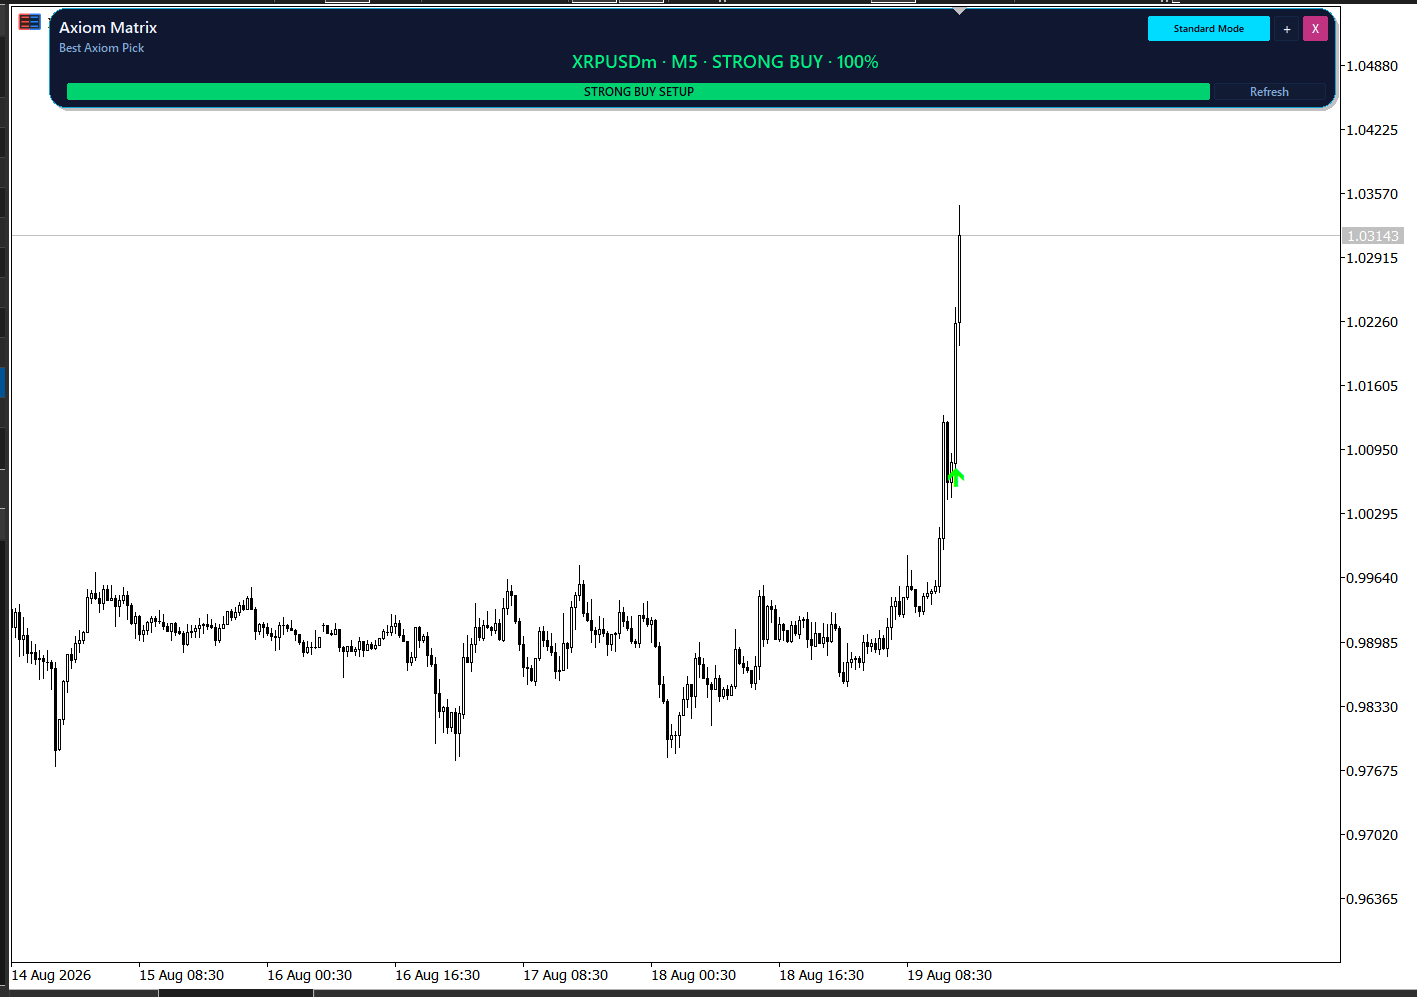
Check the selected instrument before reading the arrow. This historical August 2026 Axiom Matrix view highlights XRPUSDm M5 as the Best Axiom Pick, with STRONG BUY and a displayed 100% reading. A multi-market scanner result should be checked against the selected instrument on its own chart, including price structure and risk. The percentage is an interface reading, not a guaranteed win rate or a live recommendation. Axiom Matrix is an analysis dashboard and does not place trades. Test your setup on demo first.
https://www.mql5.com/en/market/product/182954
Issam Kassas
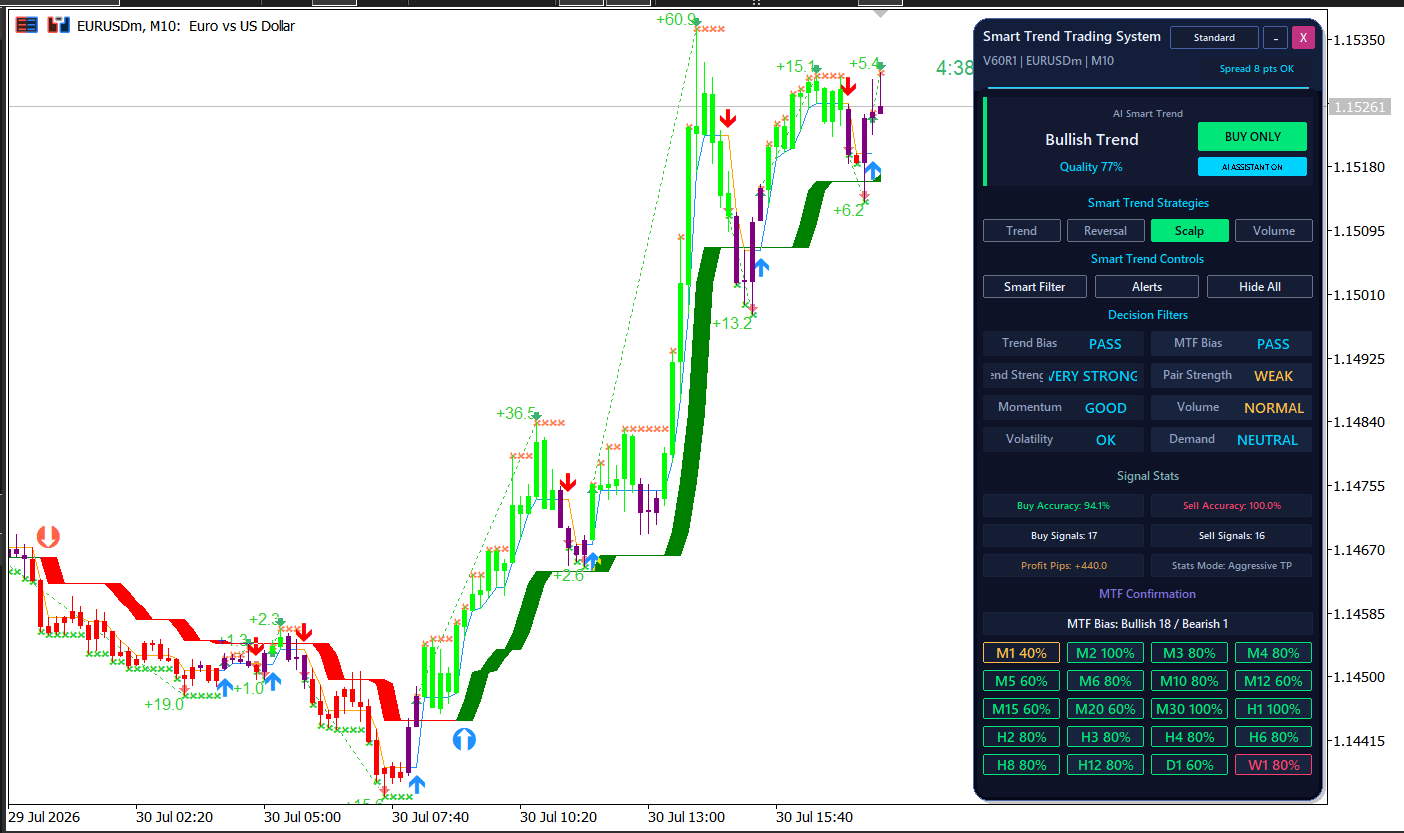
Read direction and supporting filters together. In this historical EURUSDm M10 chart from 30 July 2026, Smart Trend Trading System shows Bullish Trend and BUY ONLY with Scalp selected. Momentum reads GOOD, while pair strength is WEAK and volume NORMAL. Those readings describe different parts of the setup; compare them with price structure before interpreting an arrow. Displayed quality, accuracy and pip figures are interface statistics, not verified live results or guaranteed returns. Test settings on demo first.
https://www.mql5.com/en/market/product/103515
Issam Kassas
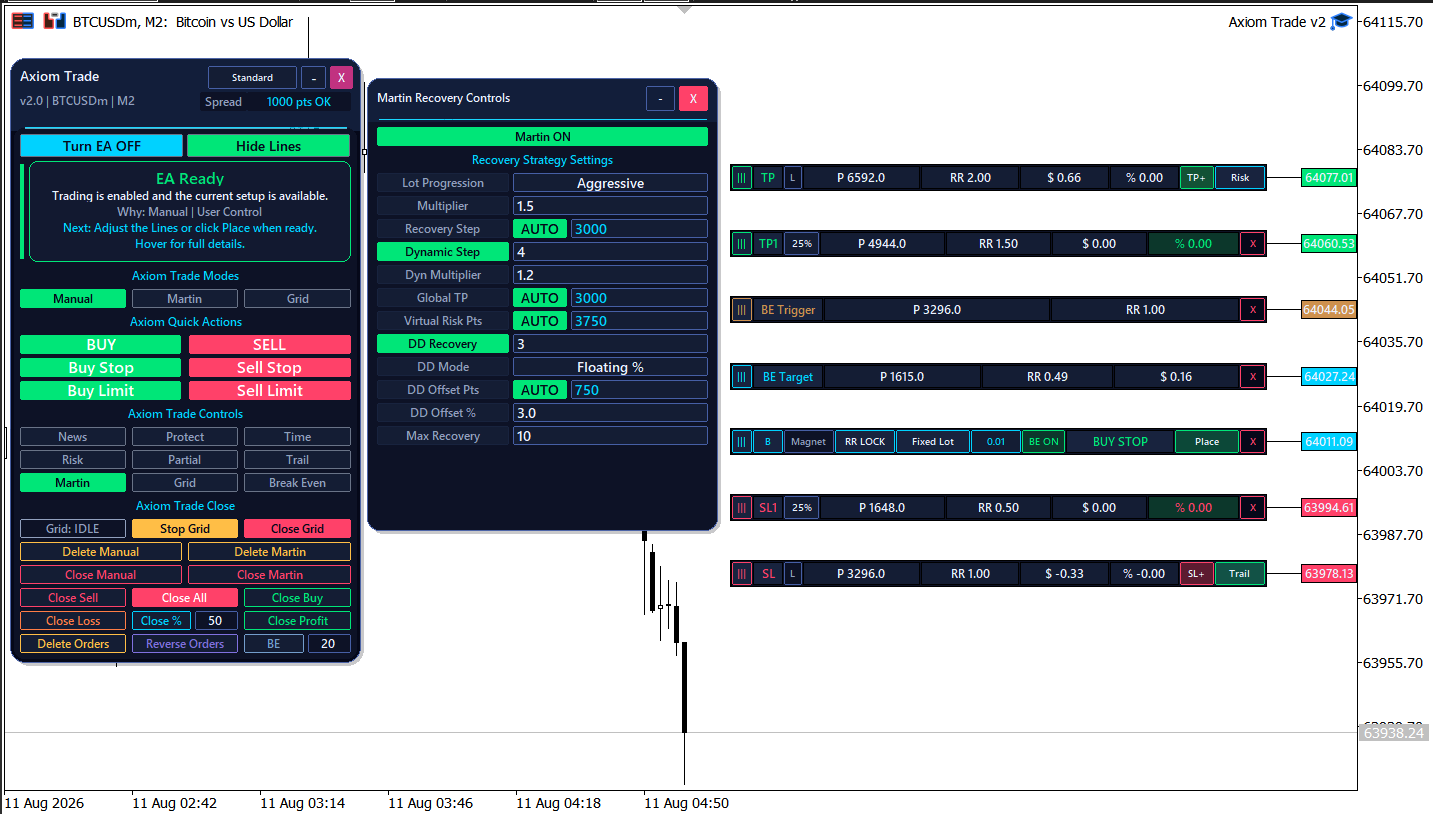
Prepare the trade before pressing Place. This historical BTCUSDm M2 example shows Axiom Trade V2 with a Buy Stop entry line, Stop Loss, Take Profit, partial exits and break-even levels. Review the distance, position size and risk-reward relationship together. The Martin Recovery panel is also visible; recovery settings can increase exposure and do not remove the risk of loss. This August 2026 interface is a setup study, not a live recommendation or verified trading result. Test settings on demo first.
https://www.mql5.com/en/market/product/184566
Issam Kassas
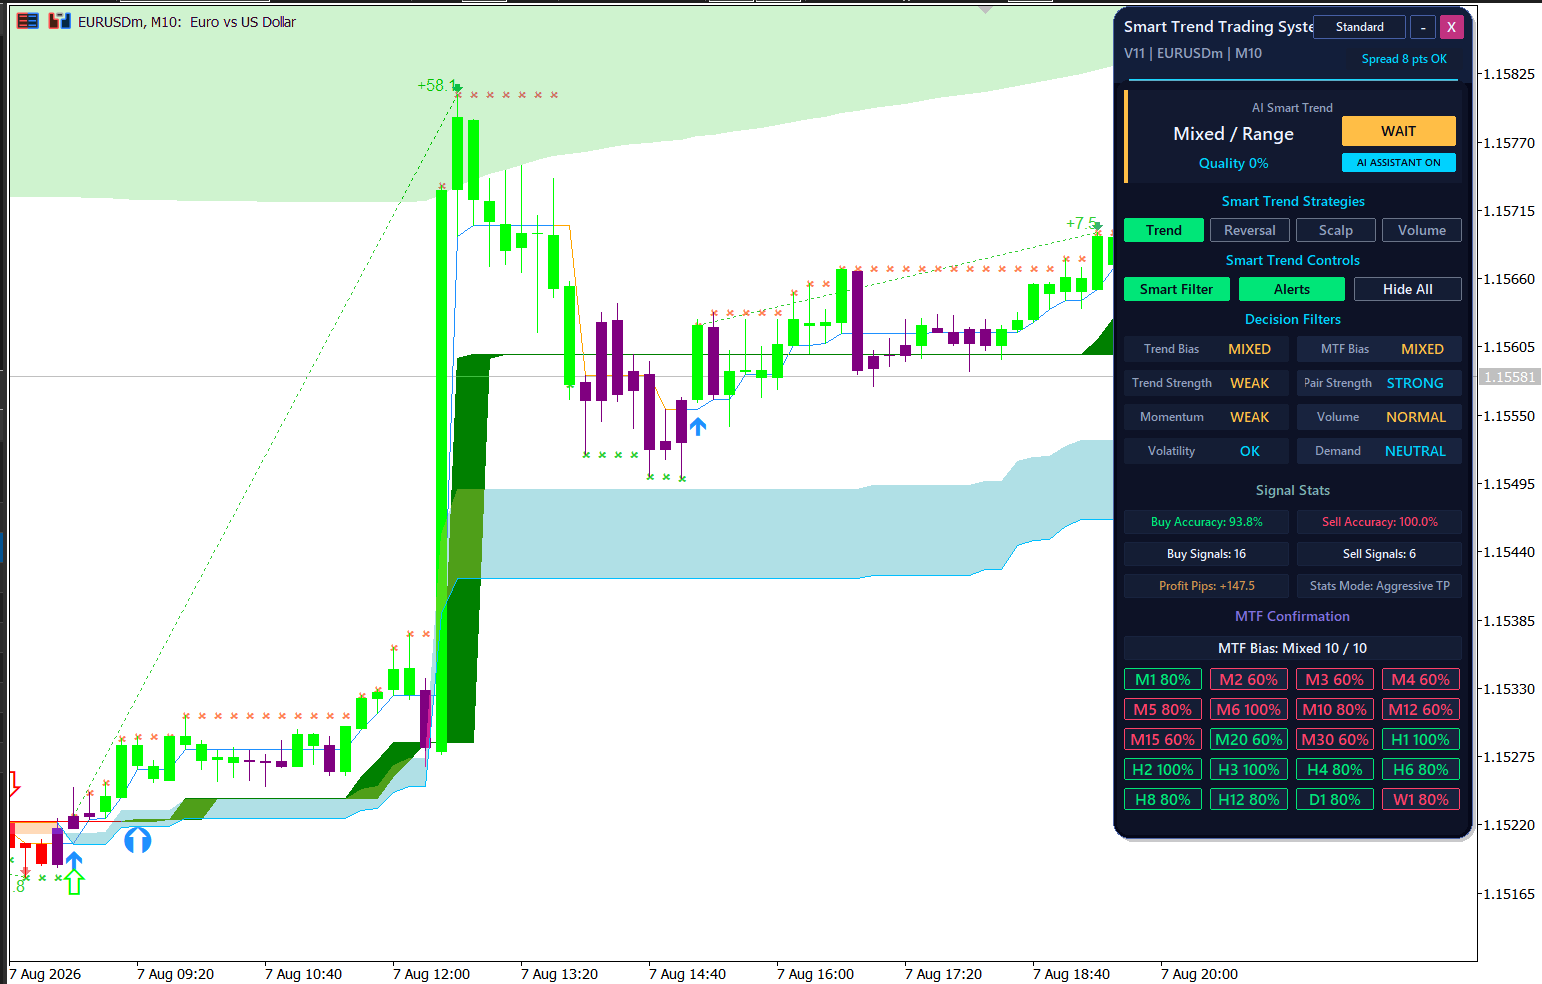
An earlier arrow does not replace the current market context. In this historical EURUSDm M10 chart from 7 August 2026, Smart Trend Trading System V11 shows Mixed / Range and WAIT, with mixed trend and multi-timeframe bias, weak momentum and normal volume. Compare those readings with price structure before interpreting a signal. The displayed accuracy and pip statistics are historical interface figures, not verified live results or a guarantee of future performance. Test your settings on demo first.
https://www.mql5.com/en/market/product/103515
Issam Kassas
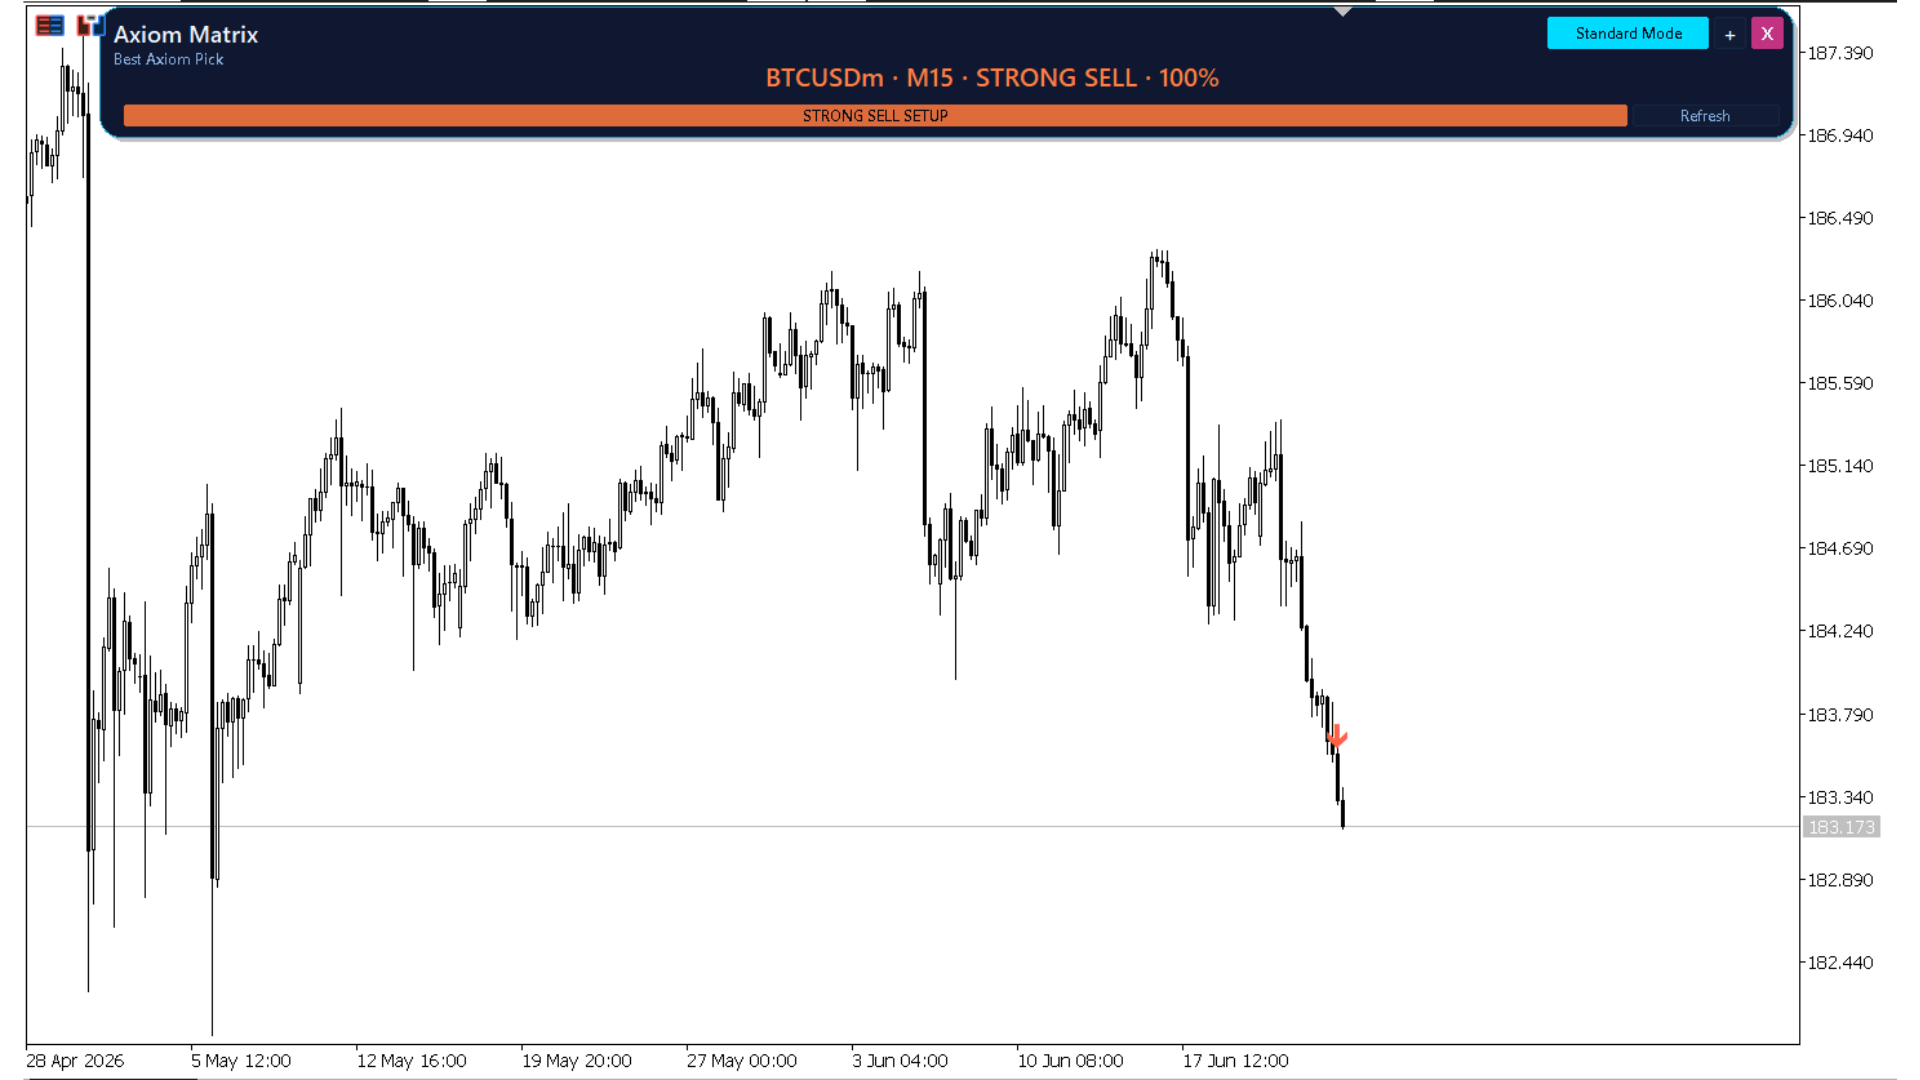
Check the symbol and timeframe before interpreting a scanner result. This historical Axiom Matrix interface highlights a Best Axiom Pick for BTCUSDm M15 with STRONG SELL and a displayed 100% reading. A scanner can compare several markets, so verify the selected instrument on its own chart before reviewing price structure and risk. The displayed percentage is not a guaranteed win rate or a live trade recommendation. Axiom Matrix is an analysis dashboard and does not place trades. Test your setup on demo first.
https://www.mql5.com/en/market/product/182954
Issam Kassas
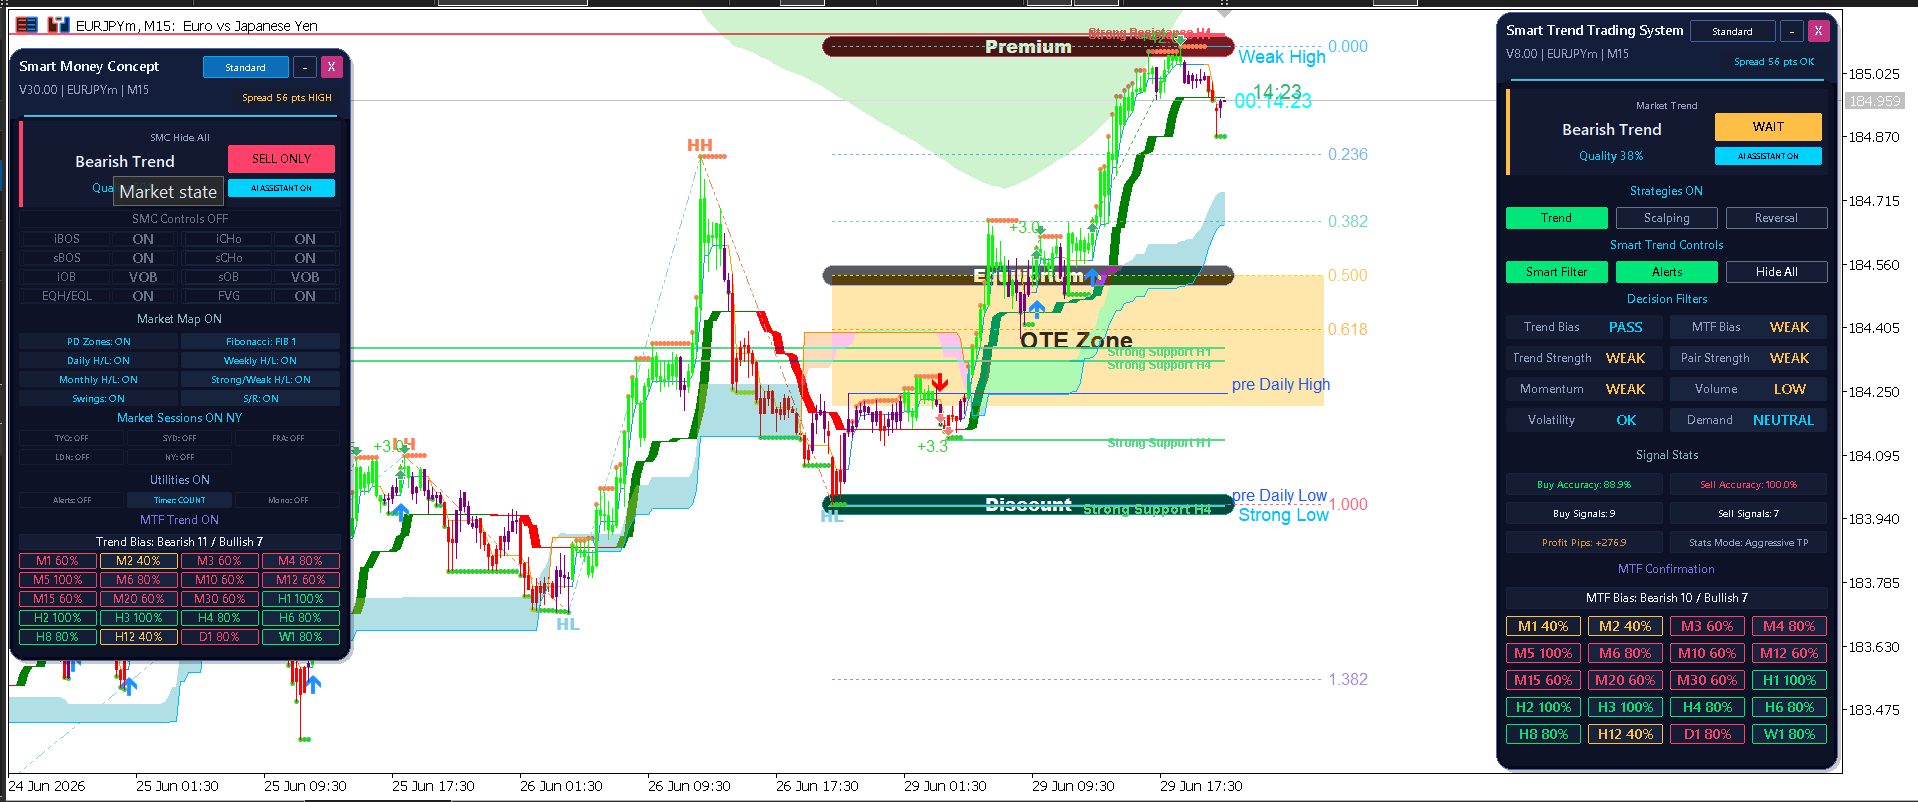
A trend label is only one part of a setup. In this historical EURJPY M15 chart, the Smart Trend panel shows Bearish Trend but WAIT, with weak momentum and low volume. Compare those filters with price structure and the separate Smart Money Concept overlays before interpreting an arrow. This June 2026 chart is an interface study; displayed accuracy and pip figures are not verified live results or a guarantee of future performance. Test settings on demo first.
https://www.mql5.com/en/market/product/103515
Issam Kassas
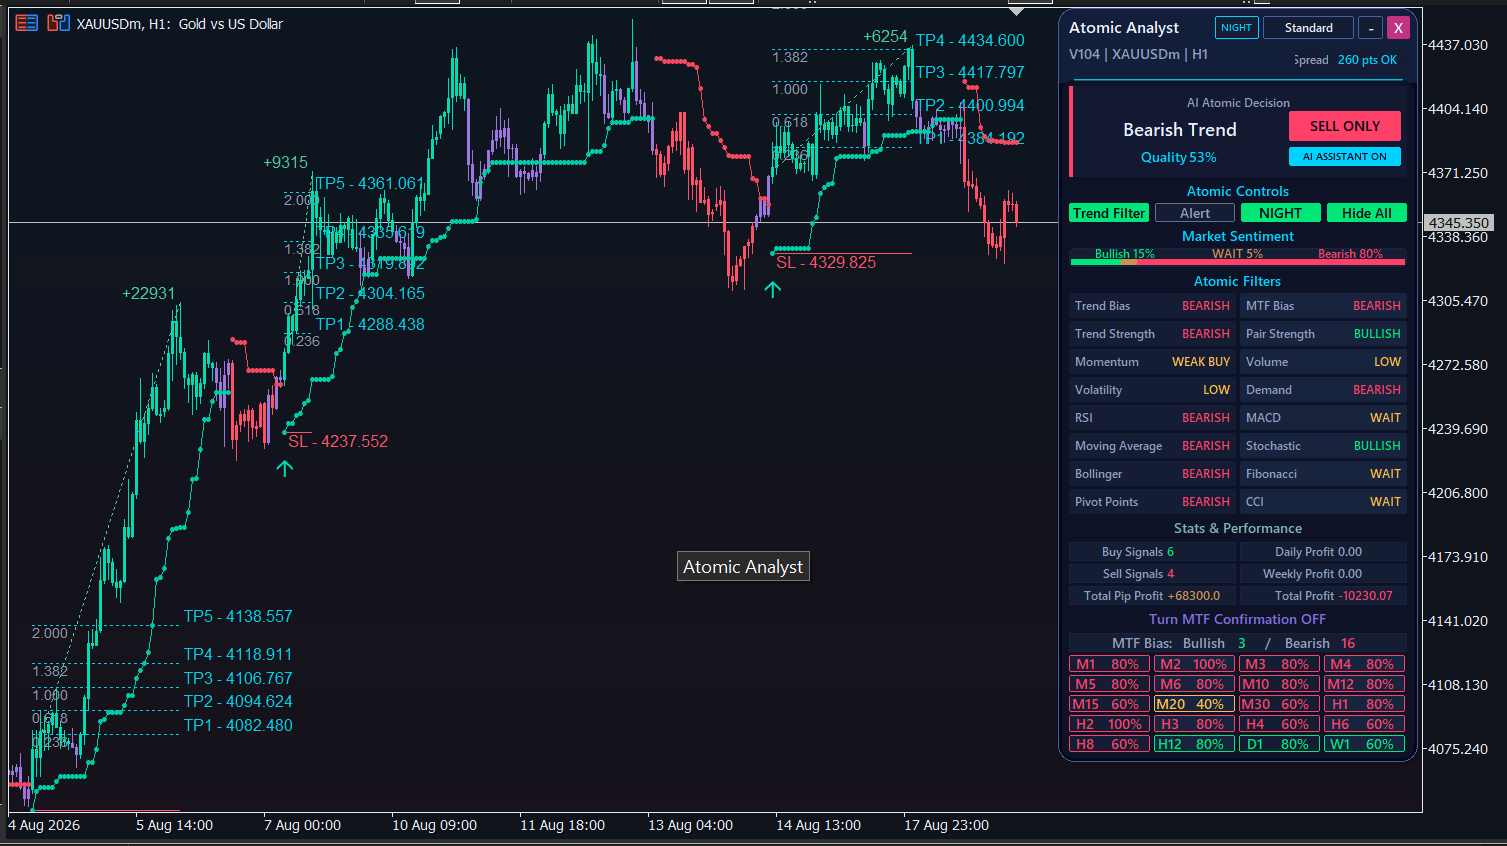
Read the supporting filters before interpreting a signal. This historical Atomic Analyst gold H1 chart shows a bearish trend while momentum reads WEAK BUY and some timeframe readings differ. Compare trend, momentum and the wider timeframe panel, then review the marked Stop Loss and Take Profit levels. This August 2026 interface example is for chart study; displayed profit and pip figures are not verified live results or a guarantee of future performance. Test settings on demo first.
https://www.mql5.com/en/market/product/114662
Issam Kassas
A bullish trend reading can coexist with flat momentum. This historical Smart Trend Trading System gold H1 chart shows that combination, alongside mixed readings across timeframes. Compare direction, momentum and the timeframe panel before interpreting an arrow. This June 2026 interface example is for chart study; the displayed accuracy and pip figures are not verified live results or a guarantee of future performance. Test your settings on demo first.
https://www.mql5.com/en/market/product/103515
Issam Kassas
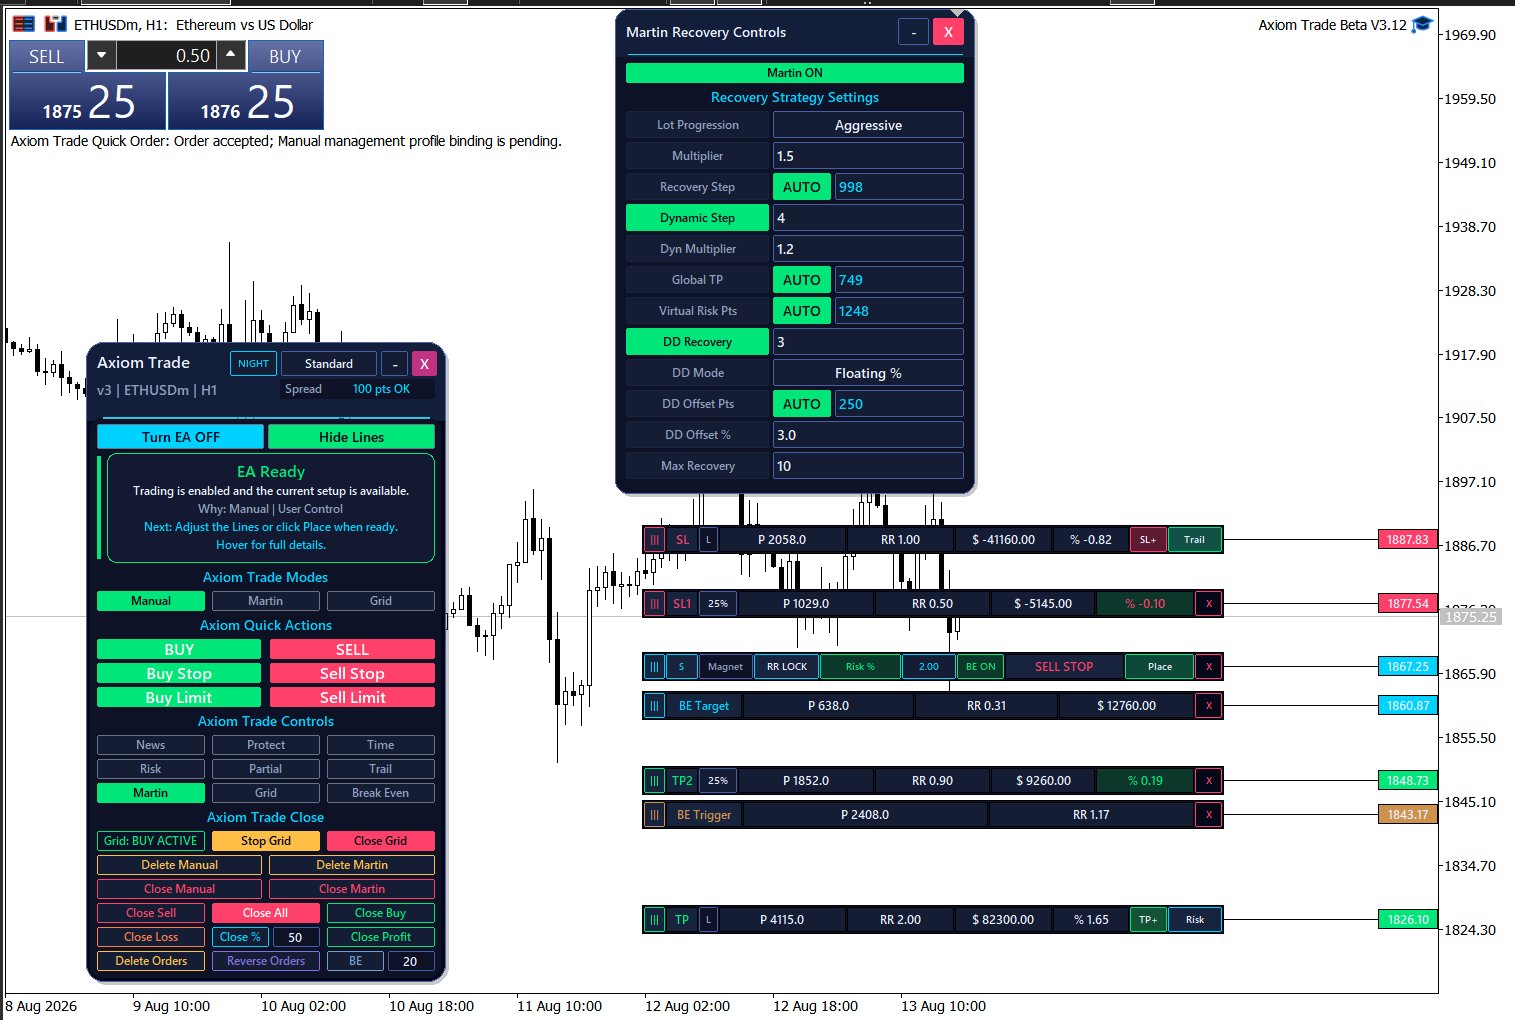
Plan the exit levels before placing an order. This historical Axiom Trade ETHUSD H1 interface shows entry, stop-loss, take-profit, partial-exit and break-even levels beside the chart, with a separate recovery settings panel. Review lot size, risk and recovery limits together: recovery and grid modes can increase exposure and drawdown. This August 2026 beta interface is an educational example, not a live performance result or a recommended configuration. Test settings on demo first.
https://www.mql5.com/en/market/product/184566
Issam Kassas
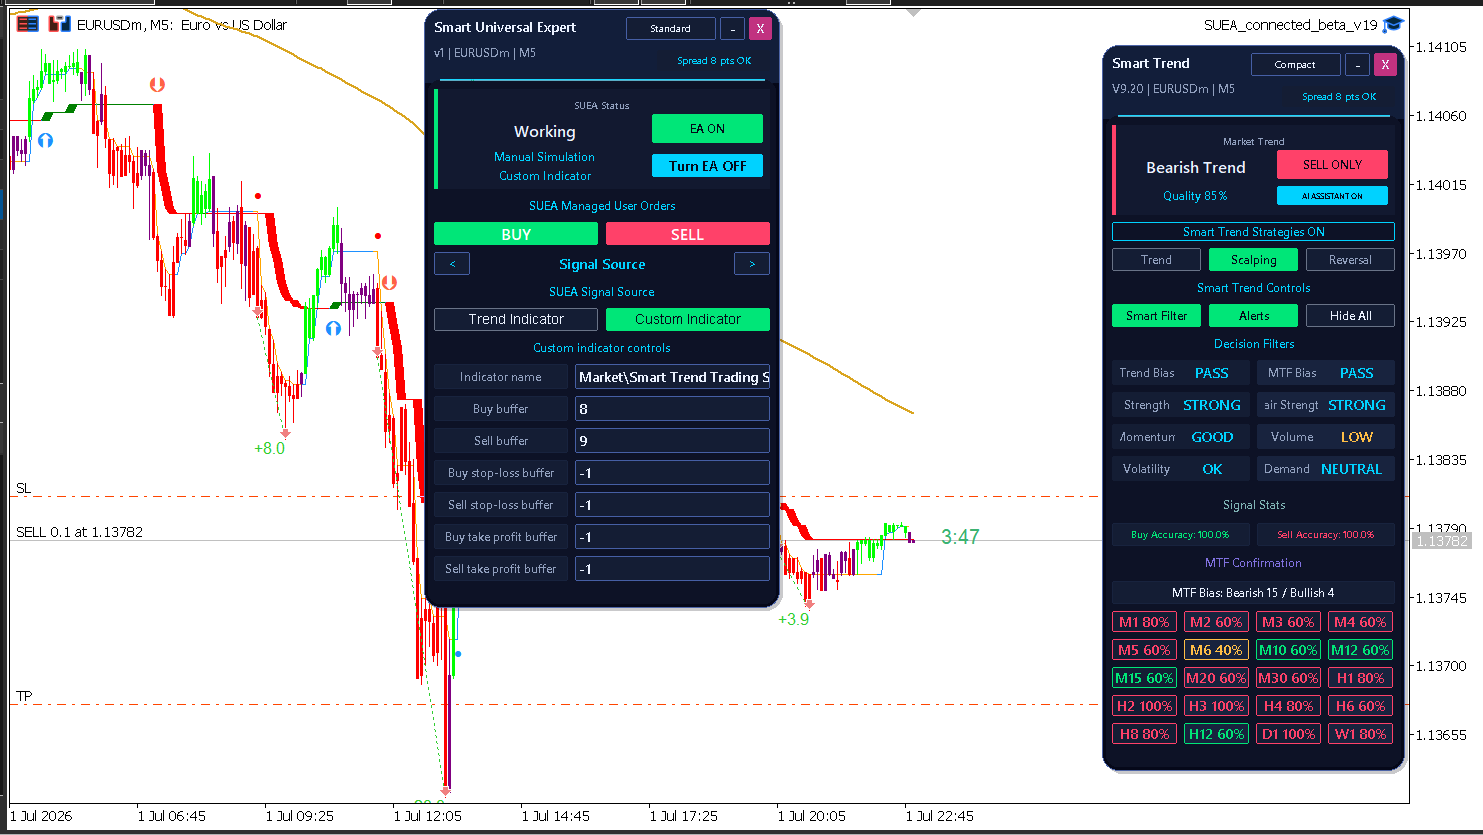
Separate the signal source from order management when studying an automated setup. This historical EURUSD M5 example shows Smart Trend alongside Smart Universal Expert in Manual Simulation, with a custom-indicator source and marked entry, stop-loss and take-profit levels. Check the selected source and risk settings before interpreting the chart. This July 2026 interface example is not evidence of live performance; displayed accuracy figures do not guarantee future results.
https://www.mql5.com/en/market/product/103515
: