
Trading Strategy that Can Pass PropFirm Challenges Successfuly

Hello, traders!
In this post, I want to share with you a trading strategy that I have developed recently and have great potential for traders who want to pass PropForms challenges and trade funded account of trading PropFirms like FTMO and FundedNext.
Follow my MQL5 channel for daily market analysis, signals and trading robots:
https://www.mql5.com/en/channels/fusion_forex_insights
**FTMO Challenge:** [FTMO Challenge Link] (click here) , check this link of the FTMO challenge that I have passed based on this strategy.
This strategy is based on four main parts: finding technical key support and resistance levels, calculating the liquidity absorption potential of the currency, measuring the relative power of the currency based on technical and fundamental analysis, and incorporating fundamental analysis and news that are related to the currency. Let’s dive into the details of each part.
Part 1: Finding technical key support and resistance levels
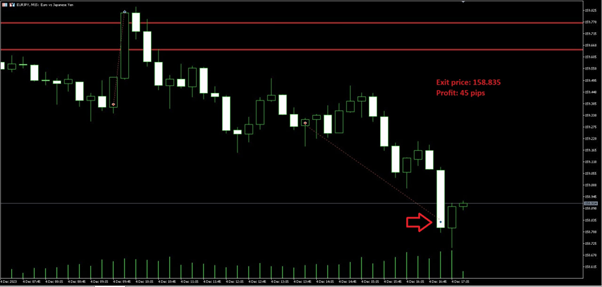
The first part of the strategy is to identify the key support and resistance levels on the chart of the trading tool. Support and resistance levels are horizontal or diagonal lines that indicate where the price is likely to bounce or reverse. These levels are determined by the previous price action, such as highs, lows, breakouts, and consolidations. Support and resistance levels can help us to find entry and exit points, as well as to set stop-loss and take-profit orders. Here is an example of how to draw support and resistance levels on the EUR/JPY chart:
[Image of EUR/JPY chart with support and resistance levels]
Part 2: Calculating the liquidity absorption potential of the trading tool
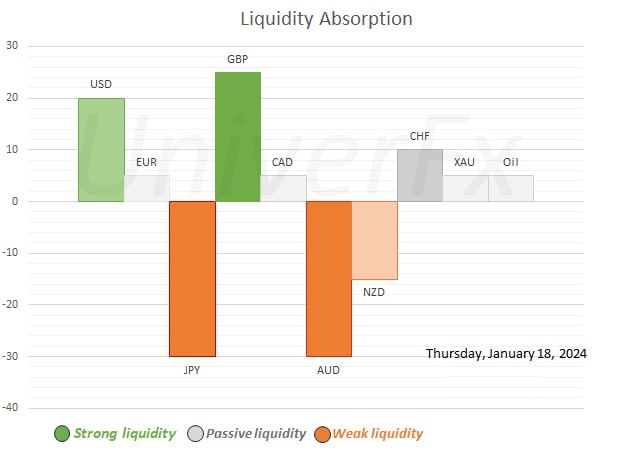
The second part of the strategy is to calculate the liquidity absorption potential of the trading currency. Liquidity absorption is the process of absorbing the excess supply or demand in the market by large institutional traders or market makers. Liquidity absorption can create price movements and reversals, as well as trap retail traders on the wrong side of the market. To calculate the liquidity absorption potential of the trading tool, we can use the Liquidity indicators, which analyzes the candlestick formations and structures to identify potential liquidity absorption zones. The Liquidity indicators use the wick-to-body ratio and the body size of the candles to determine the significance and direction of the liquidity absorption.
[Image of Liquidity indicator table data]
Part 3: Measuring the relative power of the trading tool based on technical and fundamental analysis
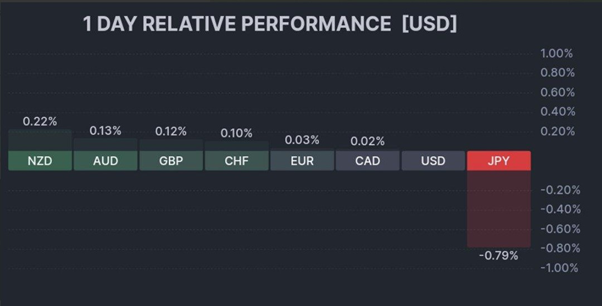
The third part of the strategy is to measure the relative power of the trading tool based on technical and fundamental analysis. Relative power is the strength or weakness of the trading tool compared to other trading tools or a common benchmark. Relative power can help us to identify the best trading opportunities and to avoid the worst ones. To measure the relative power of the trading tool, we can use Currency Strength Meters, which is a graphical representation of the strength or weakness of currencies in the Forex market. The Currency Strength Meter can show us the relative strength of all majors and help us to choose the best currency pairs to trade. Here is an example of how to use the Currency Strength Meter:
[Image of relative performance chart data]
Part 4: Incorporating fundamental analysis and news that are related to the trading tool
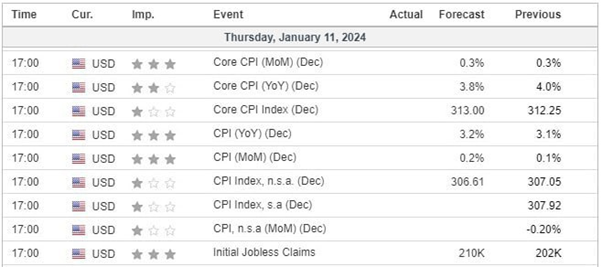
The fourth and final part of the strategy is to incorporate fundamental analysis and news that are related to the trading tool. Fundamental analysis is the study of the economic, political, and social factors that affect the supply and demand of the trading tool. News is the information and events that are happening in the world that can influence the market sentiment and the price movements of the trading tool. Fundamental analysis and news can help us to understand the underlying trends and drivers of the market, as well as to anticipate and react to sudden shocks and surprises. To incorporate fundamental analysis and news into our trading strategy, we can use the Economic Calendar, which is a tool that lists the upcoming economic data releases, central bank decisions, and geopolitical events that can impact the Forex market. The Economic Calendar can help us to prepare for the potential volatility and opportunities that these events can create. Here is an example of how to use the Economic Calendar:
[Image of Economic Calendar]
________________________________________
**Links:**
1. **Forex Fusion Insights Channel:** [Link to My Channel] (click here)
Embark on a journey of discovery as you explore the details of my triumph, learn from the strategy that led to success, and gain valuable insights that could potentially shape your trading endeavors.
Remember, success in trading is not just about the destination—it's about the journey, the strategies employed, and the lessons learned along the way. Here's to successful trading and continued success for all!
Happy Trading! 🚀📈


")
")
![[XAUUSD]: Weekly Liquidity Activation Points (timings), June 22-26, 2026](https://c.mql5.com/6/1013/splash-preview-771790.png "[XAUUSD]: Weekly Liquidity Activation Points (timings), June 22-26, 2026")