

Bitcoin opened the week with a shallow correction, but altcoin traders appear unaffected by the slight drop in BTC's price.

READ TOO
-
3 THESES THAT WILL CONTRIBUTE TO ETHEREUM AND BITCOIN IN THE NEXT BULL MARKET
- Bitcoin Rates Soar on Spot BTC ETF Hype
- For the German legislator, it is necessary for Bitcoin to acquire the status of legal tender
Bitcoin Price Analysis
Bitcoin has been holding near the channel resistance line for the past four days, but bulls have failed to initiate the next leg of the uptrend. This suggests that demand depletes at higher levels.
3 THESES THAT WILL CONTRIBUTE TO ETHEREUM AND BITCOIN IN THE NEXT BULL MARKET
Bitcoin Price Analysis
Bitcoin has been holding near the channel resistance line for the past four days, but bulls have failed to initiate the next leg of the uptrend. This suggests that demand depletes at higher levels.

If the price re-enters the channel, it will suggest that the breakout on November 9th may have been a bull trap. Short-term traders can take profits by pulling the price towards the 20-day exponential moving average ($34,961).
The overbought level on the RSI also warns of a possible short-term correction or consolidation. The correction could extend to $32,400 and eventually $31,000 if the bears drag the BTC/USDT pair below the channel.
On the other hand, if the price rises sharply and surpasses $38,000, it will indicate the start of a rally towards $40,000.
Ether price analysis
has recovered from the psychological level of $2,000 on November 12, which indicates that the bulls are trying to turn the level into support.

Buyers will make one more attempt to overcome the hurdle at $2,200. If successful, ETH/USDT could gain momentum and shoot towards $3,000 as there are no major resistance levels in the way.
BNB Price Analysis
it has been consolidating between US$240 and US$258 in recent days. This caused the RSI to fall from the overbought zone.
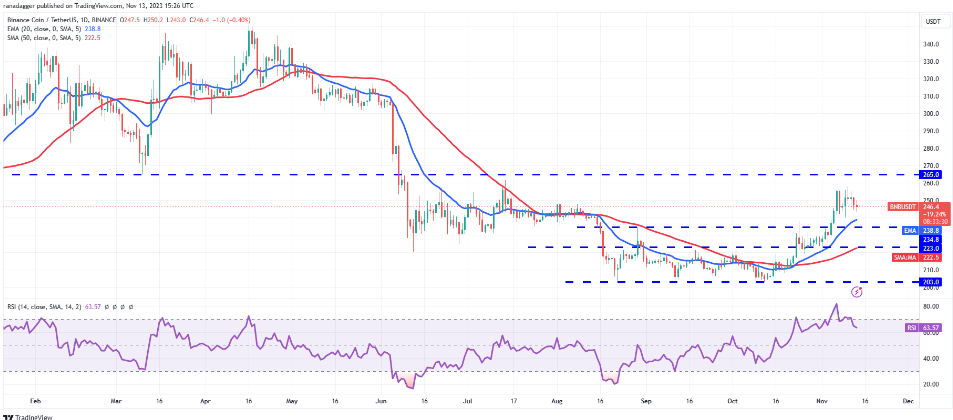
The rising 20-day exponential moving average ($238) and the RSI in positive territory indicate an advantage for buyers. If the price recovers from the 20-day exponential moving average, bulls will try to take BNB/USDT to $265. This level could again witness a fierce battle between bulls and bears, but if it is surpassed, the pair could rise up to $285.
READ TOO
XRP Price Analysis
has been trading below $0.67 for the past few days, but a positive sign is that the bulls have not allowed the price to fall below the 20-day exponential moving average ($0.62).
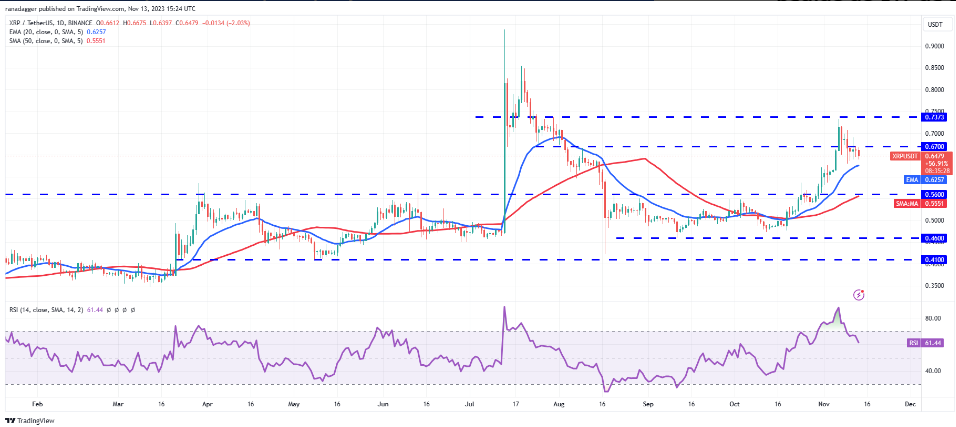
Consolidation near $0.67 increases prospects for a break above that level. If this happens, the XRP/USDT pair could rise to $0.74. This level may present a challenge, but it is likely to be overcome. This could start a rally towards $0.85.
Solana Price Analysis
it spiked above the $48 resistance on November 10 and reached $59 on November 11, but the bulls are facing strong opposition from the bears.

The rally over the past few days has taken the RSI above 88, indicating that the rally is very extended and a correction or consolidation could be near. If the price declines from the current level, SOL/USDT could slide to $48. This level is likely to attract buyers who will try to turn $48 into support.


