
Trading History - A program for trading and money management on the history of quotes in stratagy tester. It can work with pending and immediate orders, and is equipped with trailing stop, breakeven and take profit functions.
Disclaimer:
- The panel is intended for trading only on currency pairs.
- The panel is available only for the fourth version of the trading terminal:
Let me remind you that the program has a demo version that works with full functionality on the GBPJPY currency pair. You can download the demo version by clicking on the "Free Demo" button under the indicator logo.

Trading. Preparatory stage
To start trading on quote history, you need to pre-set up the terminal:
- Open the "Strategy Tester"
- In the tab on the left, select "Expert Advisor" - "Market" - "Trading History"
- Selecting a trading instrument. For example "EURUSD". If you are using the demo version, then select "GBPJPY"
- We select the timeframe on which we are going to trade. For example "H1"
- Select Test Model. For example, "Open prices only"
- Select the start and end date of testing. For example 2021 - 2023
- Activate the checkbox next to "Visualization"
First start
After completing all the settings, you must click on the “Start” button, which will start testing. Please note that on the bottom left there is a speed slider that can be changed to speed up and slow down testing.
You can also pause it, which is what you will need to do.
F12 button
By default, the chart moves automatically, but for full-fledged trading on history, this method of work is not suitable for us. Therefore, after clicking on the “Start” button, immediately stop the price movement by clicking on the pause button (two vertical lines).
After this, you can close the tester panel so that it does not disturb you. We will receive new quotes manually by pressing the "F12" button on the keyboard. Thus, during trading, when we want to think about making a trading decision, the quotes will stand still. And when we decide to see what happened next, we press the "F12" button and manually fast forward the quotes into the future. See example below:
Please note that on most keyboards the "F12" button will work without problems. That being said, there are some laptop or keyboard models that change the default value of the "F12" button. On some laptops, the "F12" button may be responsible, for example, for increasing brightness or sound.
In such situations, in order to return the default value of the "F12" button, you need to go to the keyboard properties of your device. As a second option, I can recommend assigning the "F12" buttonto one of the side buttons on your mouse, if any. This is how I work and it’s much more convenient than using the keyboard.
Customization
If you are not satisfied with the green-black gamma, then you can change it in the screen parameters. You can also change the bars to candlesticks, or, if desired, to a line chart. The grid can be removed using the key combination "Ctrl + G". See the example below:
Adding indicators
Depending on what strategy you are testing, you may need indicators on the chart. They are added to the chart in the strategy tester in the same way as to a regular chart. To do this, click on the "Insert" - "Indicators" button and select the one you need. Below, using the example, I will add the “Alligator” and “Fractals” indicators to the chart.
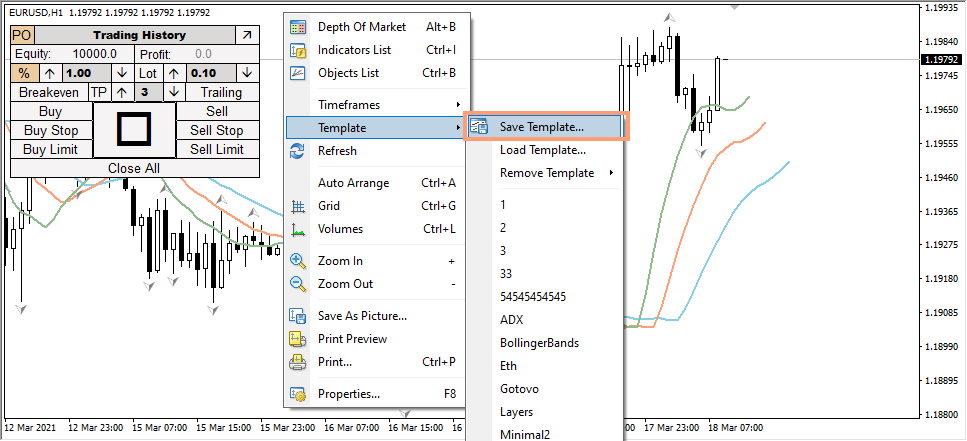
To avoid having to adjust the appearance of the chart every time before testing, you can save it into a template along with all the indicators that are on it. To do this, after setting up a chart on history, right-click on the screen and select “Template” - “Save template”. Give the template a name and save it to the default folder.
Loading templates
For each trading strategy that you will test, I recommend preparing a set of templates that you can load onto the chart in a few clicks. In the example below, I will load a template with the "Fractal" and "Alligator" indicators. See how quickly you can get your chart ready.
Loading quotes
In some cases, when you try to start testing, the tester may simply not start. This may happen because you selected a date that is too old and there are simply no quotes in the terminal to test it. Most often, the terminal loads quotes on its own, but if it doesn’t do this, then you need to help it and load quotes manually.
This is done very simply. Let's imagine that we are going to trade the GBPUSD currency pair and for this we need all available quotes for this instrument.
Go to “Tools” - “History Center” - Look for the desired currency pair - Select the desired timeframe and click load.
Make sure that the name of the instrument you intend to trade exactly matches the quotes you download. People often make the mistake of downloading quotes, for example for GBPUSD, and trading GBPUSD.m.
Trading instruments
Some brokerage companies do not allow trading of some quotes. Therefore, if panel does not work on your broker's terminal, try to change quotes(for example EURUSD.m to EURUSD). If this does not help, download the terminal of another broker.
It’s easy to check whether our panel works for your broker. Download the demo version of the "Trading History" program and run it on the GBPJPY currency pair. If the panel works normally, then all other quotes will also work after purchasing the full version.
Having dealt with the preparatory stage, we can move on to the description of the trading panel itself:
Money Management
The panel provides two ways of money management:
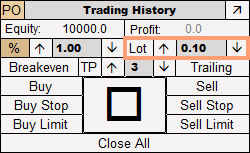
Fixed Percent Method
The essence of the method is that one trading operation always uses the same risk, which is set on the indicator panel. By default it is 1%, but you can increase and decrease it using the up and down arrows. The lot size in this case will depend on the size of the Stop Loss. The higher the Stop Loss size, the lower the lot size. The smaller the Stop Loss, the bigger the lot size.
Default percentage change step = 0.5. Can be changed in the external parameters of the indicator. The "stepPercent" parameter is responsible for this.
Trading Lot
Implies the use of a predetermined trading volume. To activate this money management method, click on the "Lot" button. The default volume = 0.1 lot and can be changed using the up and down arrows.
The lot change step can be changed in the external parameters of the indicator. The "stepLot" parameter is responsible for this.
TakeProfit, Breakeven, Trailing Stop
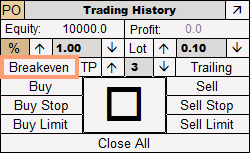
"Breakeven" - responsible for moving a trade to breakeven. As soon as the price moves into the positive zone within the range allowed by the broker, clicking on the "Breakeven" button will move your Stop Loss to the trade opening level.
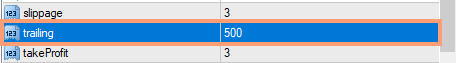
"Trailing" - enables the "Trailing Stop" function. When the price passes a certain range (for example, 500 points on the fifth symbol after the dot or 50 points on the fourth symbol after the dot), the price moves to the trade opening level and moves along with the price as it moves.
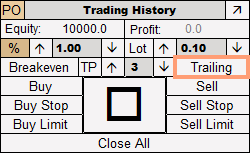
It is important to note that for different currency pairs the trailing stop parameter must be selected separately, since different instruments have different volatility. The size of the trailing stop is determined by the "Trailing" parameter in the external parameters of the panel.
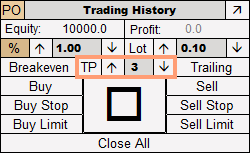
"TP" - responsible for setting the "Take Profit" order. The default ratio is 1 Stop Loss = 3 Take Profit. When you click on the "TP" button, Take Profit will be set. The ratio of Stop Loss to Take Profit can be changed using the down and up arrows.
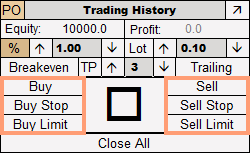
Trade orders
The panel is capable of opening both immediate and pending orders. Currently available:
- Buy
- Sell
- Buy Stop
- Buy Limit
- Sell Stop
- Sell Limit
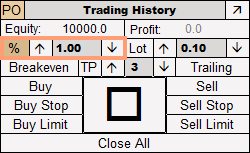
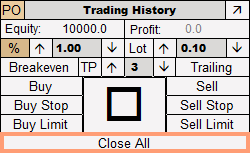
If you do not use pending orders in trading, you can remove it by clicking on the “PO” button in the upper left corner of the screen. In the example below, I turned off pending orders and left only immediate ones.
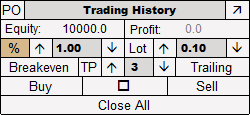
The "Close All" button is intended to close all orders on the current chart, as well as to delete all pending orders on the current chart.
Panel activation
In order to activate the panel, you need to click on the large square button in the center. After clicking it, two lines (orange and blue) will appear on the chart, and the spread will also be displayed under the current price line.
In the version of the "Trading Helper" panel for the real market, everything happens instantly. You can see an example of panel activation in the picture below. This is explained by the fact that any action performed by the panel is made with the arrival of a new tick on the chart, and ticks on the current chart are constant. The same applies to opening trades, which we will talk about a little later.
In "Trading History" everything works in an identical way. Any action (activating the panel, opening trades, etc.) with moving quotes occurs instantly. But, if you are paused, nothing will happen until you press the "F12" button, or turn off pause mode.
For example, if we activate the panel while paused, then you need to perform two actions:
- 1. Press the big square button
- 2. Press the "F12" key, which activates the arrival of a new tick
Below, using an example, I will first show how the activation of the panel works when quotes are moving, and then how the activation of the panel works when paused by pressing the "F12" button.
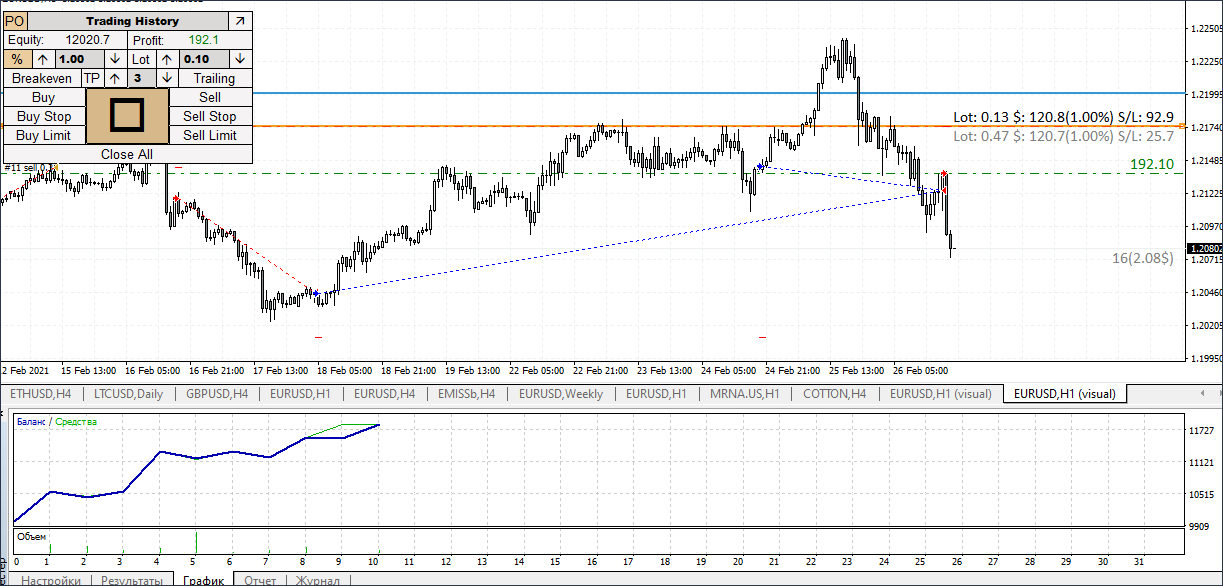
Now let's look at the lines that appeared after activation.
Orange line - Potential Stop Loss level for immediate and pending orders. Must be placed where you intend to place your Stop Loss level.
Blue line - Level of a potential pending order. It doesn't matter which one. Must be placed where you are going to place a pending order.
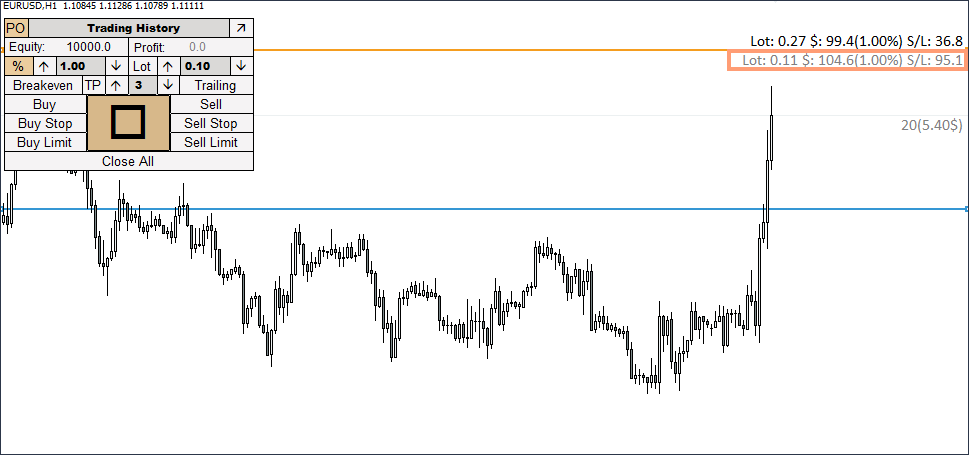
Information above the orange line
Above the orange line is information about a future immediate order. From left to right:
- Lot - Lot for the current trading operation
- $ - Risk in the deposit currency in dollars (risk as a percentage of the deposit)
- S/L - Stop Loss size in pips
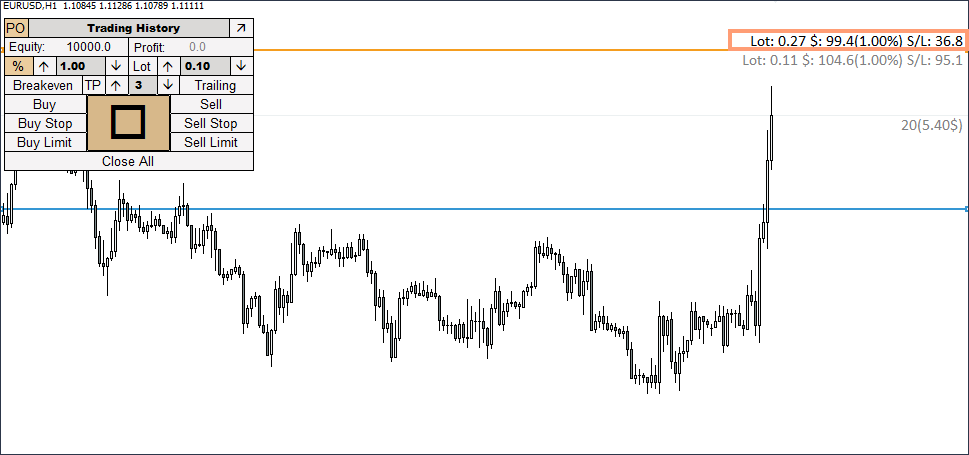
Information under the orange line
Below the orange line is information on a future pending order. From left to right:
- Lot - Lot of the future pending order
- $ - Risk in the deposit currency in dollars (risk as a percentage of the deposit)
- S/L - Stop Loss size in points for a pending order
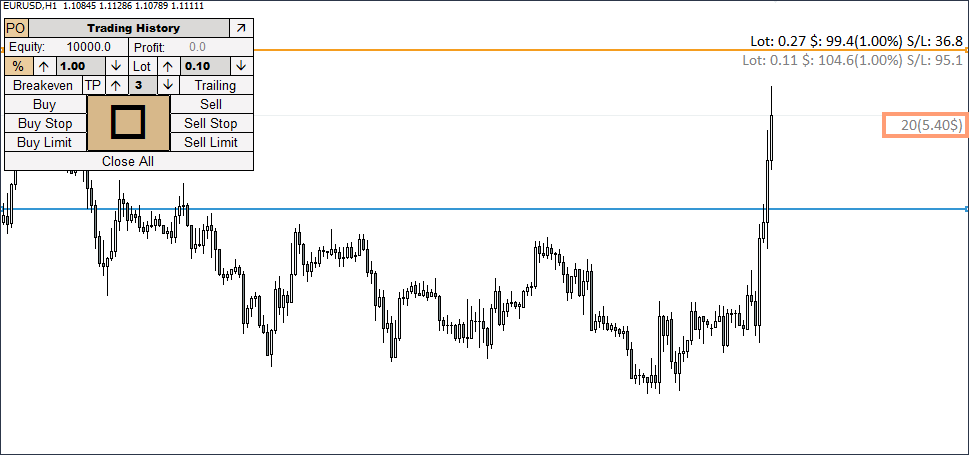
Spread
Below the current price line you can see the spread for the future trading operation. It is displayed in points and in deposit currency (calculated based on the lot value of the immediate order).
Opening an immediate order
To open an immediate order, you need to drag the orange line to the level of your future Stop Loss and click on the “Buy” or “Sell” button. If the line is not active (there are points to the right and left of it in the active phase), then you should activate it by double-clicking on it with the left mouse button.
Below, using the example, I will open sell and buy trades, having previously turned off pending orders. There is no need to disable them. An immediate order will work in any case.
Setting a pending order
To place a pending order, we need both lines: blue and orange.
Buy Stop - move the blue line above the current price and the orange line below the blue one
Sell Stop - move the blue line below the current price and the orange line above the blue one.
Buy Limit - move the blue line below the current price, and the orange line below the blue one.
Sell Limit - move the blue line above the current price, and the orange line above the blue one.
Trading result
After testing is completed, you can view the trading results in the “Graph” tab, as well as receive a full report on all transactions in the “Report” tab. In fact, this will be a kind of analogue of the statistics that you get from a real account.
External parameters:
- startCoordX - The position of the panel about the X axis
- startCoordY - Panel Y position
- maxLotValue - The maximum possible lot value that the program opens
- maxPrcentValue - The maximum possible percentage of risk
- useRiskRounding - rounding the risk percentage values
- pendingOrder - Whether or not to use pending orders
- Deposit - Choose between Deposit and Equity to display on the panel
- stepPercent - Percentage step
- steplot - Lot step
- sippage - Slippage
- traling- Value for trailing stop
- Fractal_Stop Loss - Offset in points from the fractal stop loss level.
- FractalTrailingBars - (1) Use fractals where the second bar after the fractal is not closed/ (2) Use fractals where the second bar after the fractal is closed. A parameter for a fractal trailing stop.
- takeProfit - The ratio for the take profit function
- diapason - Deviation of order control lines from the current price
- showProfitLoss- Whether or not to display the current profit on the right above the order on the chart
- showSpread - Whether or not to display the current spread above the current price
- colorTextSpread - Spread display text
- movelinesAfterOpenOrder - Offset of order control lines after opening an order
- pipsspread - Line offset range.
- resetHotKeys- Hotkeys for shifting order control lines
- positonTextOnLine - Position for text above the order control line
- InfoTextFont - The font for the text above the order control line.
- InfoTextFontsize - Font size for text above the order control line
- colorTextLine - Information color for the immediate order
- colorTextLinePending - Information color for a pending order
- SLLineThick - Potential stop line thickness
- PendingLineThick - Line thickness of a potential pending order
- styleline - Potential stop line style
- styleLinePending - Line style of a potential pending order
- colerLine- Color of the potential stop line
- colorLinePending - Line color of a potential pending order
- colorTracing - Panel stroke color
- colorTextBtn- The color of the text on the panel
- colorFonButton - Panel background color
- colorBack - Background color of editable panel elements
- colorTextBack - Text color of editable panel elements
Author: Siarhei Vashchylka. For any questions, write to me in private messages. I also recommend subscribing to my updates. To do this, follow the link to my profile and click "Add to friends"


