
Gold, precious metals market. Technical analysis of XAU/USD for the period from 09/19/2022 to 09/25/2022.
The future dynamics of quotes of absolutely any financial instrument can be modeled using the approaches of chaos theory using fractal geometry tools.
The main aspects of the modeling method are described in the article “To know what to buy, what to sell, you need to read charts.”.
You can get acquainted with the technique of reading graphs in the short video “The Alphabet of Niro Attractors.”.
Below, in chronological order, is the fractal marking of the charts of the dynamics of GOLD quotes for the time period 19.09.2022-25.09.2022, indicating models of possible future dynamics of quotations.
Gold, dynamics forecast from 09/19/2022.
The fractal structure of the chart with a time frame of 1 Week.
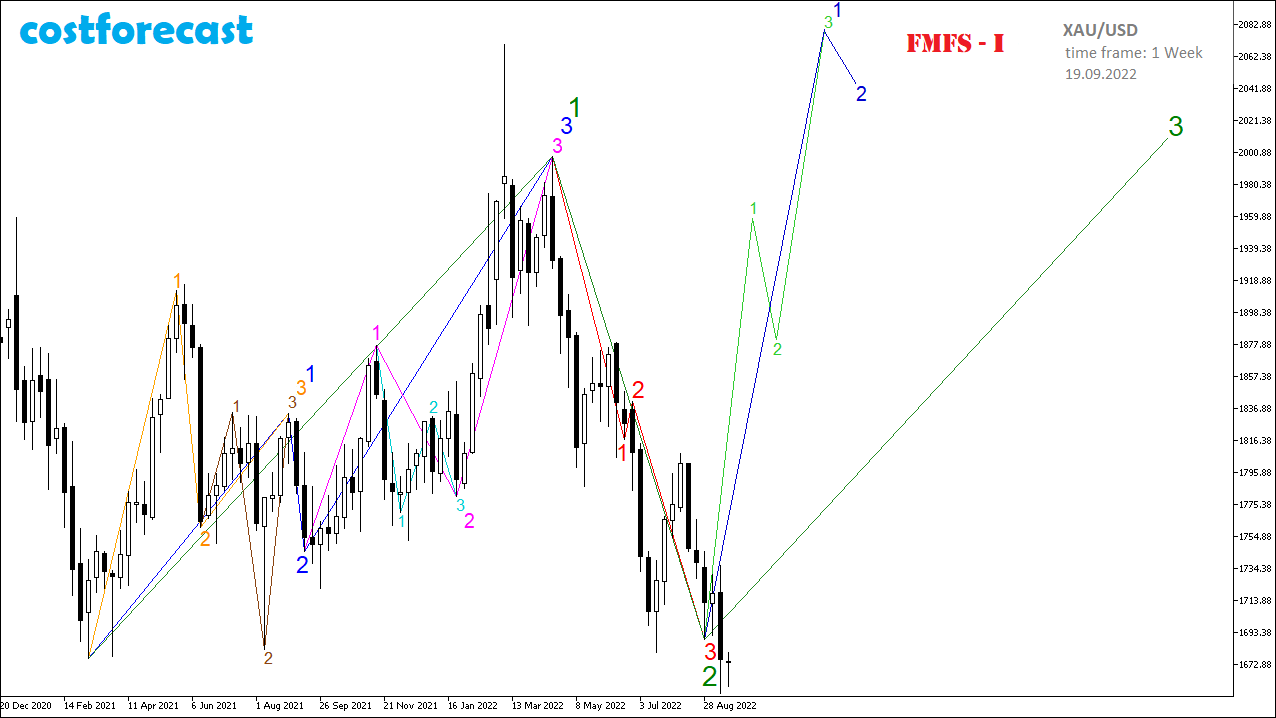
Gold, dynamics forecast from 09/19/2022.
The fractal structure of the chart with a time frame of 1 Week.
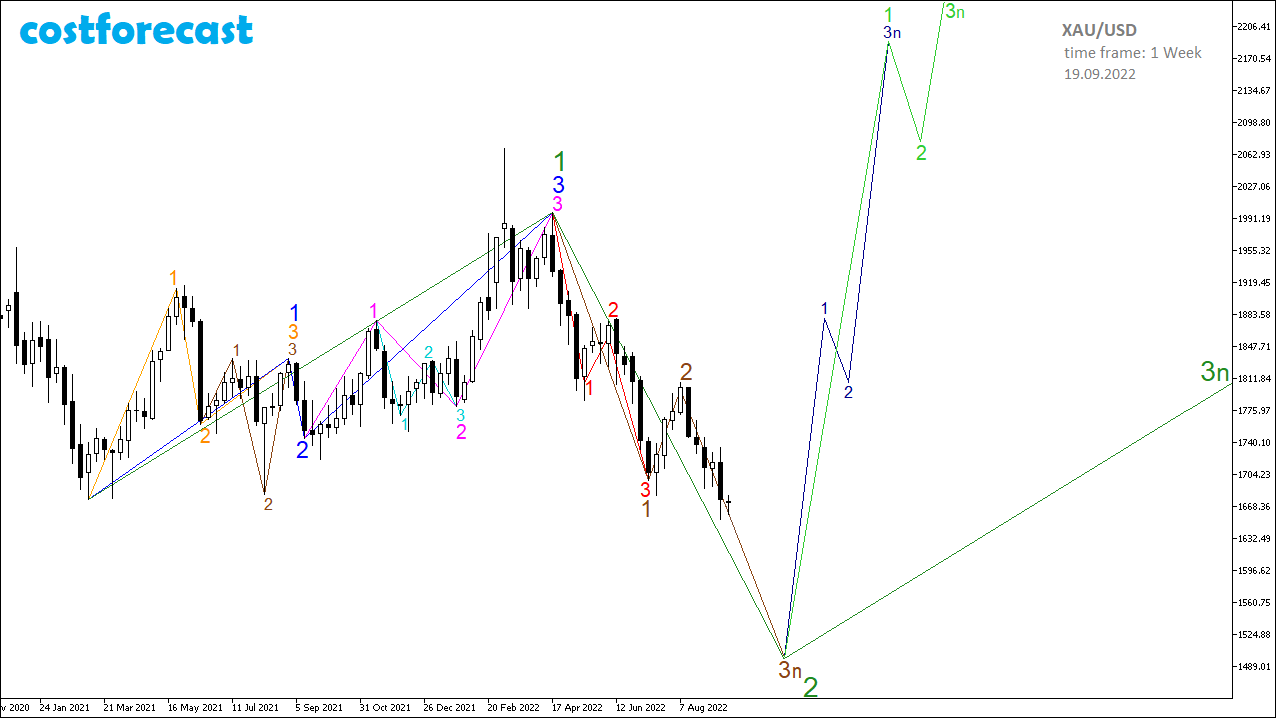
An analysis of the current fractal structure on the chart of the dynamics of quotations of Gold, built with a time frame of 1 week as of 09/19/2022, gives reason to talk about the need to return to consideration as the main model the model built on 07/14/2022 with one clarification that on the time interval (04/18/2022; 07/14/2022) in the form of a red fractal F21, not the 2nd segment of the fractal of a higher order, marked in green, was completed, but the 1st segment of the fractal, marked in brown, which after its completion will be the 2nd green fractal segment.
With this in mind, the future dynamics of quotes will continue the downtrend as part of the continuation of the formation of the 3rd segment of the brown fractal.
Gold, dynamics forecast from 09/19/2022.
The fractal structure of the chart with the time frame 1 Day.
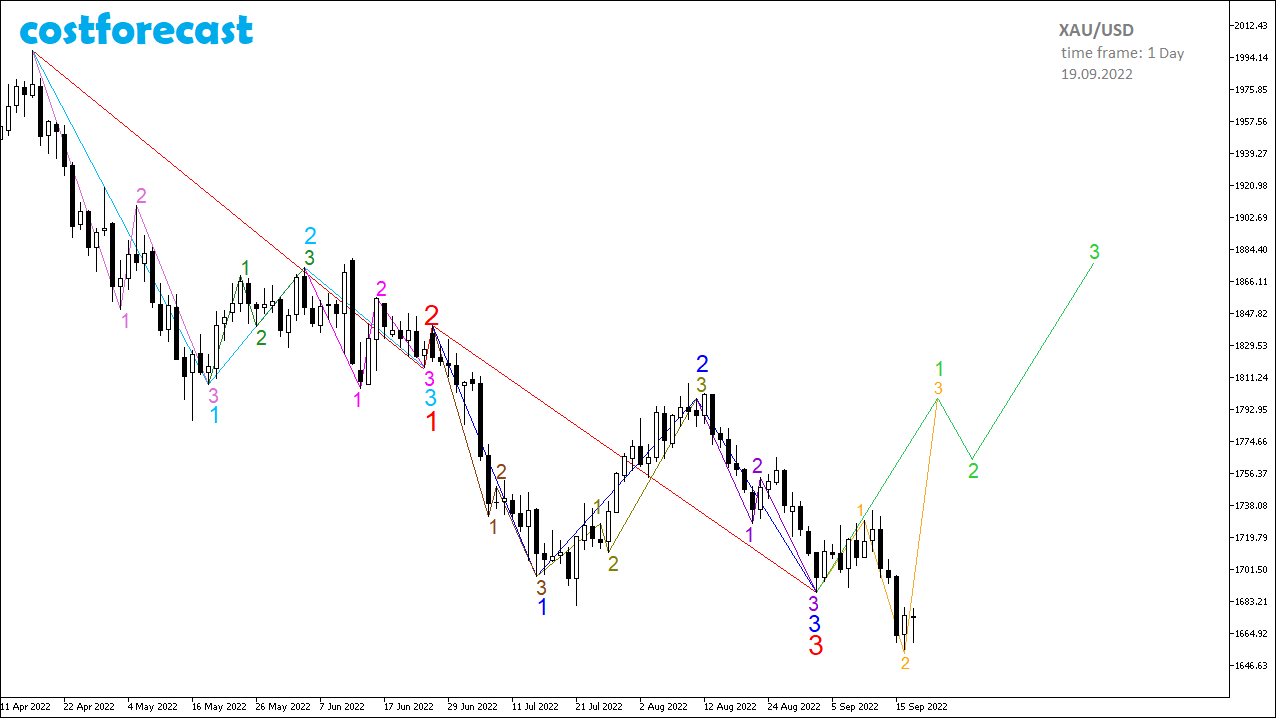
Gold, dynamics forecast from 09/19/2022.
The fractal structure of the chart with the time frame 1 Day.
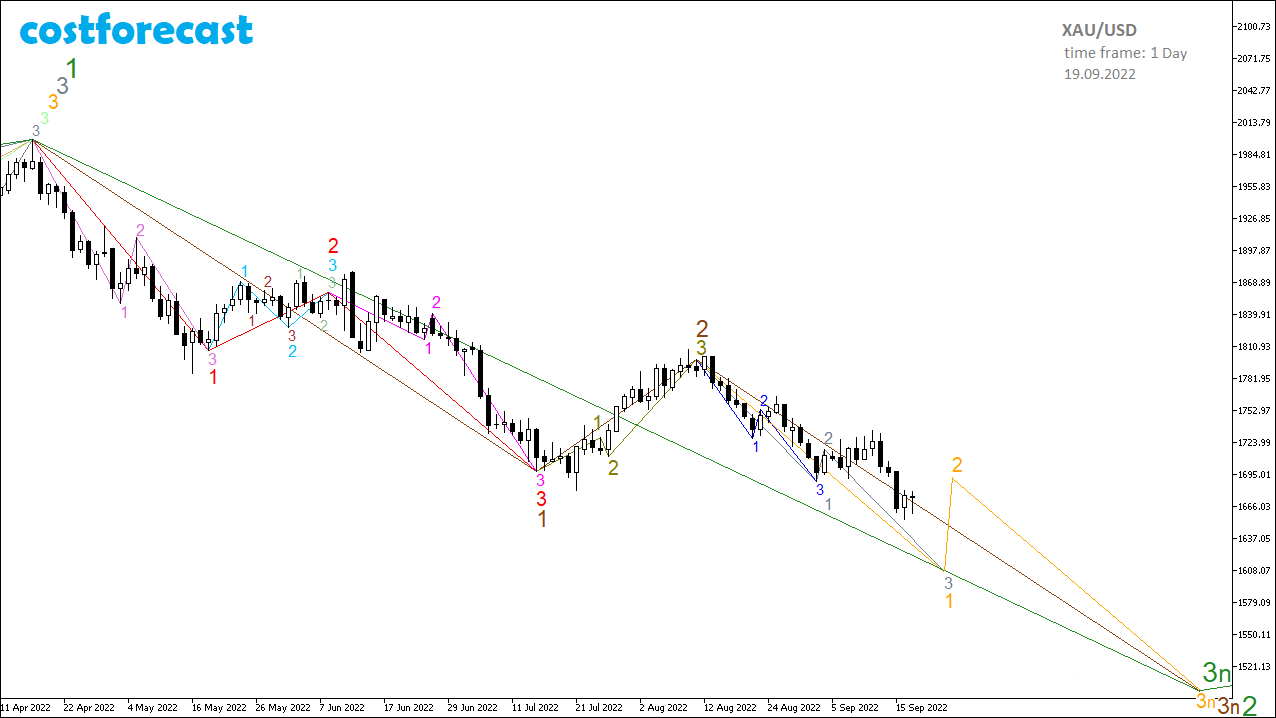
An analysis of the low-order fractal structures that have developed as of 09/19/2022 allows us to say that in the fractal structure of the chart of the dynamics of the Gold quotes, built with a time frame of 1 day, the model will most likely be implemented, according to which the 3rd segment of the fractal is currently being formed, which is marked in brown on the chart, and which is the 2nd segment of the higher order fractal, marked in green.
The 1st segment of the brown fractal is indicated by a red fractal on the time interval (04/18/2022; 07/14/2022), the 2nd segment of the brown fractal is indicated by an olive fractal on the time interval (07/14/2022; 08/11/2022), the 3rd segment brown fractal began to form at the point with coordinates (08/11/2022; 1799.10) and is indicated on the chart as an orange fractal F21.
Taking into account the current fractal structure, it can be assumed that the 1st segment of the orange fractal will form as an F21 fractal, indicated in gray, the 1st segment of which is indicated on the chart by the blue F21 fractal on the time interval (08/11/2022; 09/01/2022). In this case, the future dynamics of quotes will continue in a downtrend as part of the completion of the formation of the 3rd segment of the gray fractal, which completes the 1st segment of the orange fractal. After that, a corrective upward movement should follow as part of the formation of the 2nd segment of the orange fractal, followed by a downtrend already within the formation of the 3rd segment of the orange fractal, which will complete the 3rd segment of the brown fractal, which has an order of one higher, and which will end the downtrend of quotes that began on April 18, 2022, the end of the 2nd segment of the green fractal.
Gold, dynamics forecast from 09/19/2022.
The fractal structure of the chart with a time frame of 3 hours.
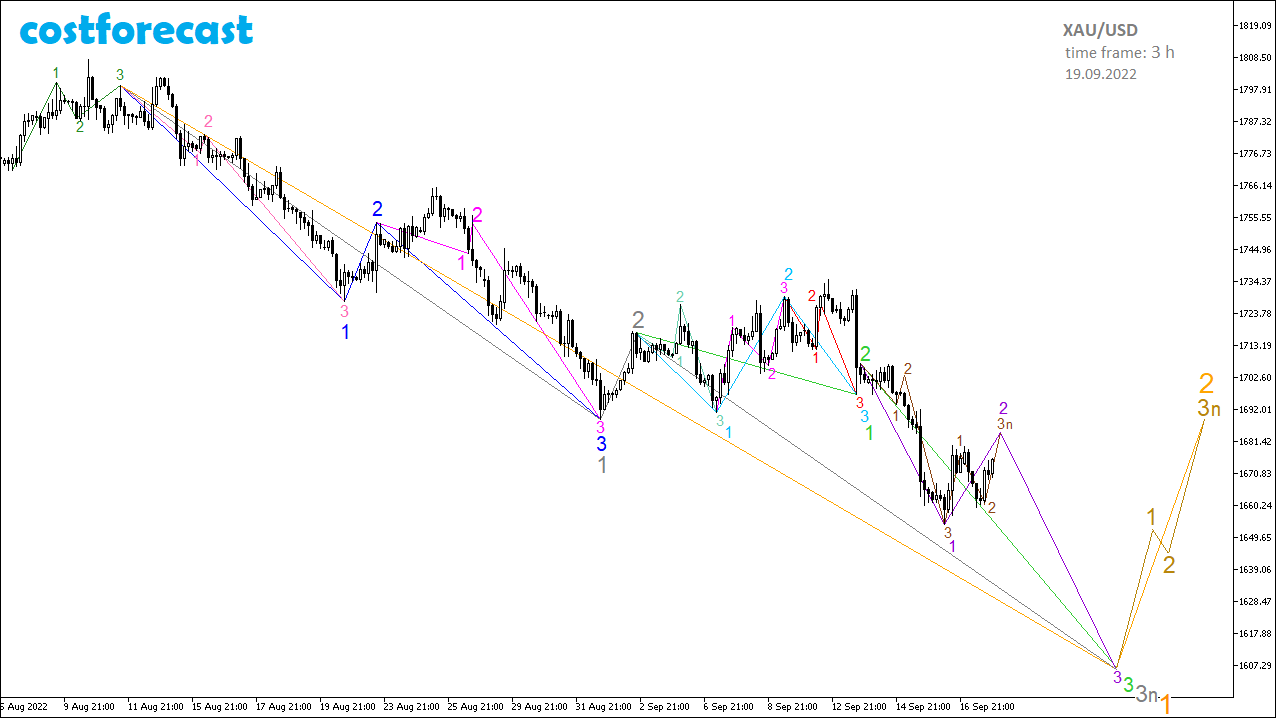
The fractal structure that has developed as of 19.09.2022 on the chart of the dynamics of quotations of Gold, built with a time frame of 3 hours, requires adjustment of the model of future dynamics, considered from 01.09.2022 as the main one.
Taking into account the current development of the dynamics, the most probable development scenario is the formation of the F21 fractal, indicated in the graph in gray and representing the 1st segment of the fractal of a higher order, which is indicated in orange, originating at the point with coordinates (11.08.2022_15:00; 1799,10).
The 1st segment of the gray fractal is a fractal of a lower order, which is indicated in blue on the time interval (11.08.2022_15:00; 01.09.2022_15:00). The 2nd segment of the gray fractal formed as a mono-segment on the time interval (09/01/2022_15:00; 09/02/2022_18:00). The current dynamics of quotes is in the stage of formation of the 3rd segment of the gray fractal.
At the moment, we can assume that the 3rd segment of the gray fractal will be formed in the form of an F11 fractal, marked in bright green.
The 1st segment of the bright green fractal is indicated by the blue F24 fractal on the time interval (09/02/2022_18:00; 09/13/2022_15:00), the 2nd segment is indicated by a mono-segment on the interval (09/13/2022_15:00; 09/13/2022_18 :00).
With this in mind, the future dynamics of GOLD quotes will take place in a downtrend as part of the formation of the 3rd segment of a bright green fractal, indicated on the chart by the purple F12 fractal, with the completion of which the 3rd segment of the gray fractal and the 1st segment of the orange fractal will also end . After that, a corrective upward movement will follow as part of the formation of the 2nd segment of the orange fractal.
Gold, dynamics forecast from 09/19/2022.
The fractal structure of the chart with a time frame of 1 Hour.
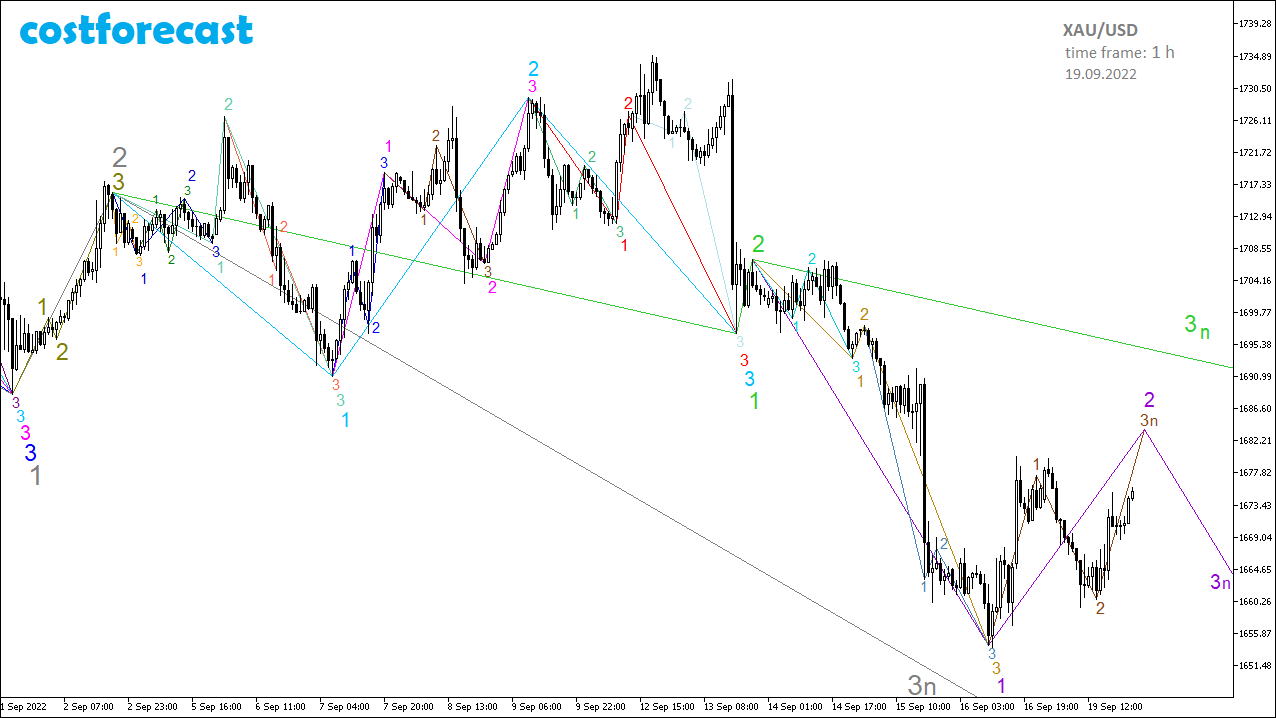
The most likely scenario for the development of the dynamics of GOLD quotes as of 09/19/2022 is the implementation of the model, according to which a fractal, marked in bright green, will form in the fractal structure on a chart built with a time frame of 1 hour.
At the moment, we can say that on the time interval (09/02/2022_19:00; 09/13/2022_16:00) a fractal has formed, indicated in blue, which is the 1st segment of a fractal of a higher order, indicated in bright green.
The 2nd segment of the bright green fractal formed on the time interval (09/13/2000_16:00; 09/13/2022_20:00).
The current dynamics of quotes is in the stage of formation of the 3rd segment of a bright green fractal, which is indicated on the chart by a fractal of a lower order in purple, in particular its 2nd segment in the form of a brown fractal, after which the downward dynamics will continue as part of the formation of a 3- th segment of the purple fractal.
Gold, dynamics forecast from 09/19/2022.
The fractal structure of the chart with a time frame of 12 minutes.
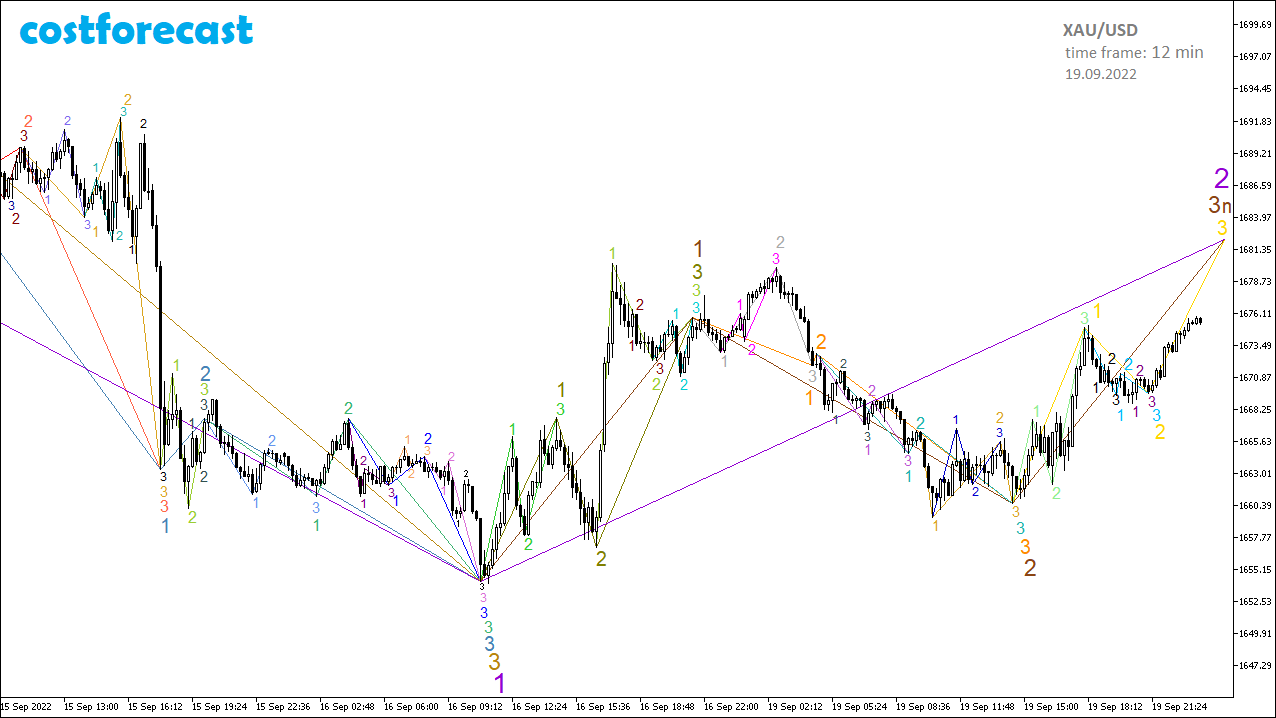
An analysis of the fractal structure of the chart of the dynamics of GOLD quotes, built with a time frame of 12 minutes as of 09/19/2022, suggests that at the point with coordinates (09/16/2022_10:48; 1654.14) the 1st segment of the fractal, indicated in purple, was completed color.
In this case, the current dynamics of quotes is in the process of forming the 2nd segment of the purple fractal, the 1st segment of which was formed as an olive fractal on the time interval (09/16/2022_10:48; 09/16/2022_21:24), and the 2nd segment - in the form of an orange fractal on the time interval (09/16/2022_21:24; 09/19/2022_14:24).
The current dynamics of quotes forms the completion of the 3rd segment of the olive fractal in the fractal structure, marked in yellow on the chart.
Gold, dynamics forecast from 09/20/2022.
The fractal structure of the chart with a time frame of 12 minutes.
Gold, dynamics forecast from 09/20/2022.
The fractal structure of the chart with a time frame of 1 Hour.
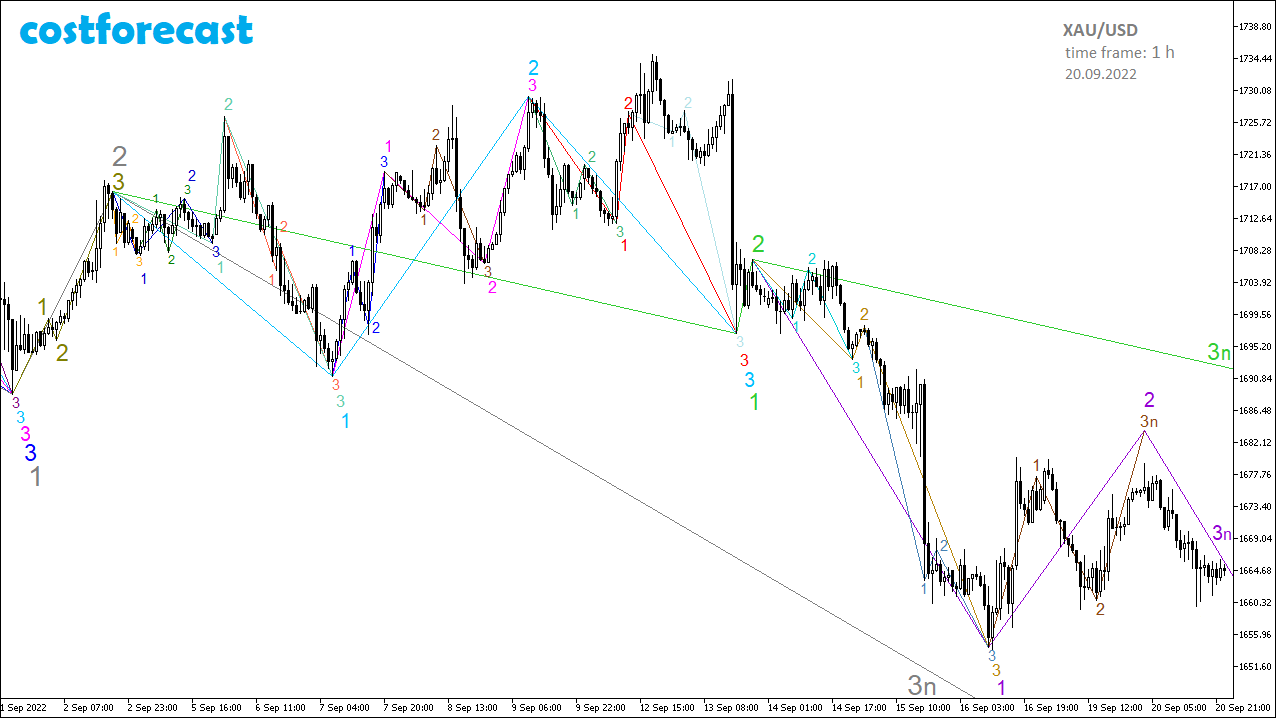
Gold, dynamics forecast from 09/20/2022.
The fractal structure of the chart with a time frame of 12 minutes.
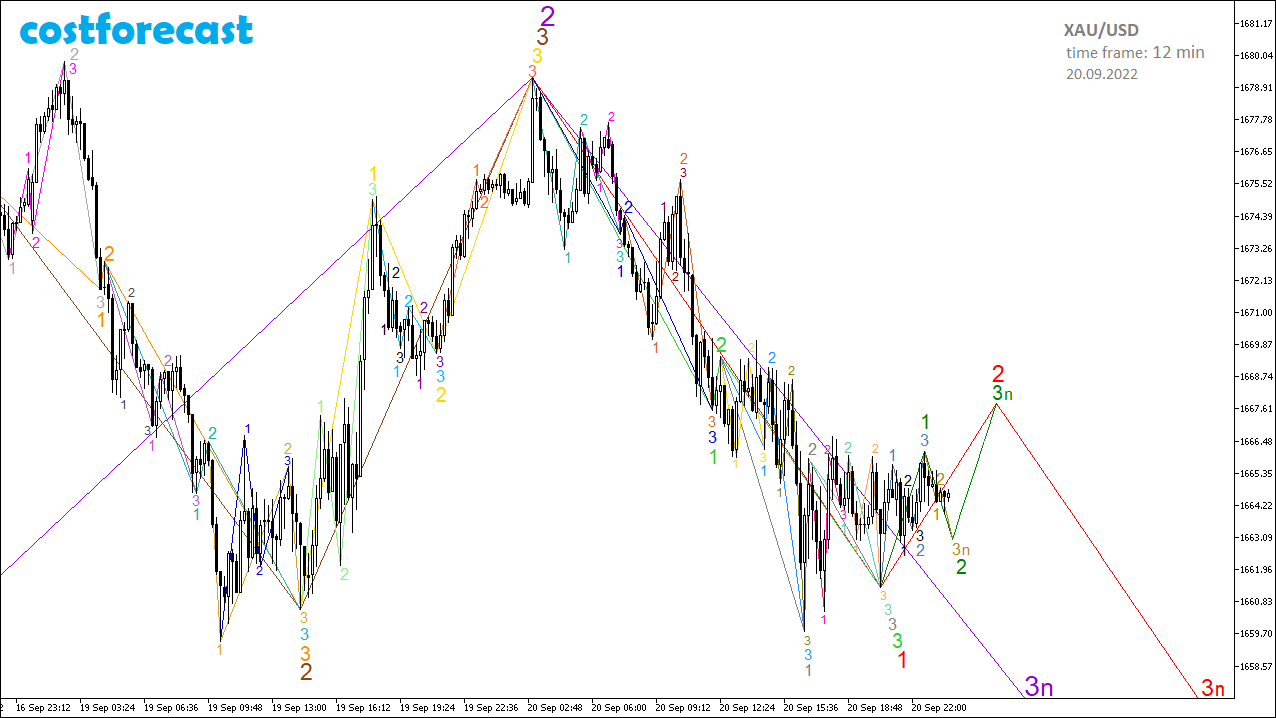
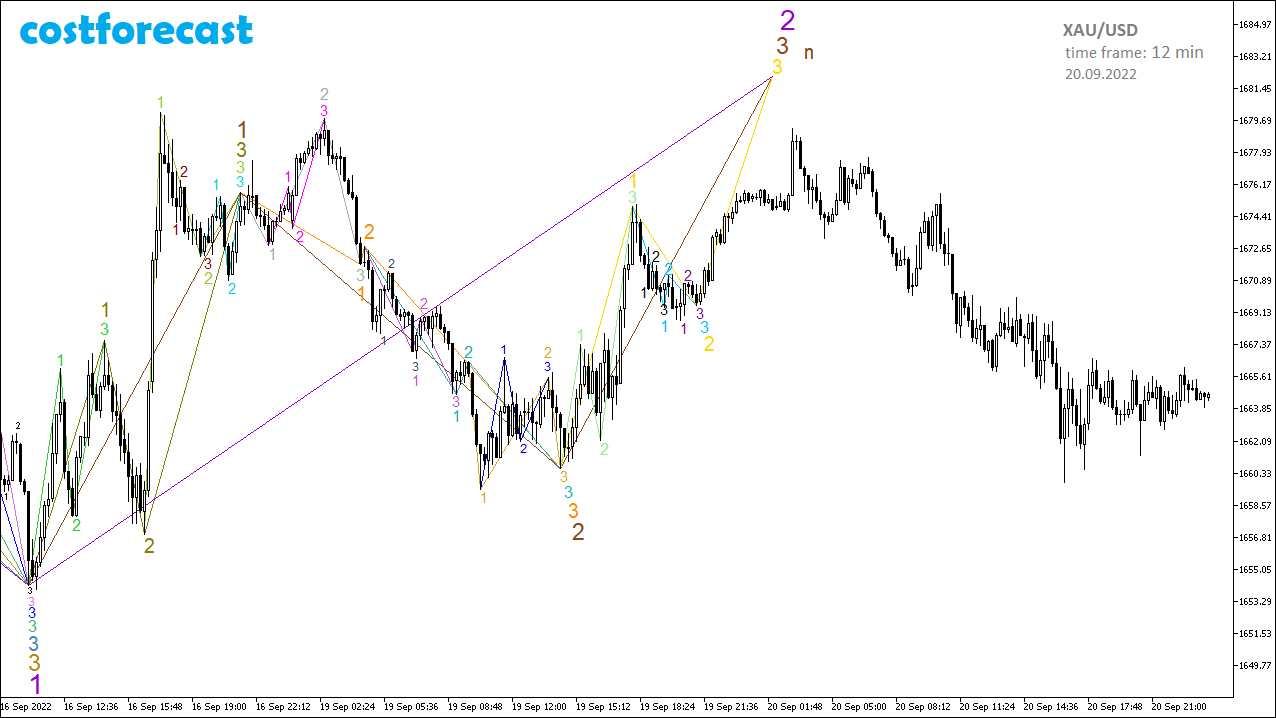
Taking into account the existing fractal structure on the chart of the dynamics of quotations of Gold, built with a time frame of 12 minutes as of 09/20/2022, it can be assumed that on the time interval (09/19/2022_14:24; 09/20/2022_03:00) segment of the brown fractal, denoted by the yellow fractal of lower order.
The end of the brown fractal completed the formation of the 2nd segment of the fractal of a higher order, indicated in purple. In this case, the downward dynamics that has begun will continue within the framework of the formation of the 3rd segment of the purple fractal, indicated in red on the chart.
At the moment, we should expect lateral dynamics as part of the completion of the 2nd segment of the red fractal, indicated by the green fractal F22, which has a lower order, taking into account the fact that the 1st segment has formed on the time interval (09/20/2022_03:00; 09/20/2022_20:24) this red fractal.
Gold, dynamics forecast from 09/20/2022.
The fractal structure of the chart with a time frame of 1 Hour.
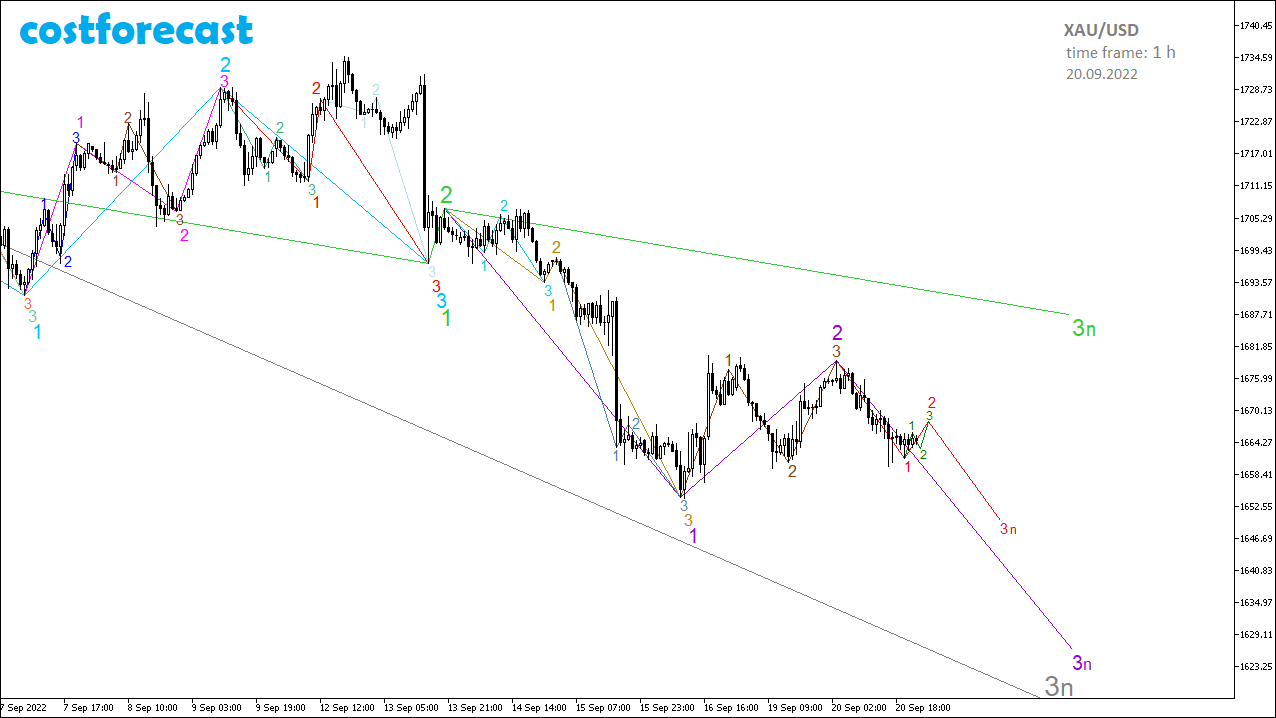
The most likely scenario for the development of a fractal structure on the chart of the Gold quotes dynamics, built with a time frame of 1 hour as of September 20, 2022, is the implementation of a model according to which the third segments of fractals of various orders are formed simultaneously: gray fractal, bright green fractal, purple fractal.
At the moment, it can be assumed that the current dynamics of quotes is in the stage of formation of a fractal, indicated in green, which is the 2nd segment of a higher-order fractal, indicated in red, after which the downward dynamics should continue as part of the formation of the 3rd red segment fractal.
Gold, dynamics forecast from 09/21/2022.
The fractal structure of the chart with a time frame of 12 minutes.
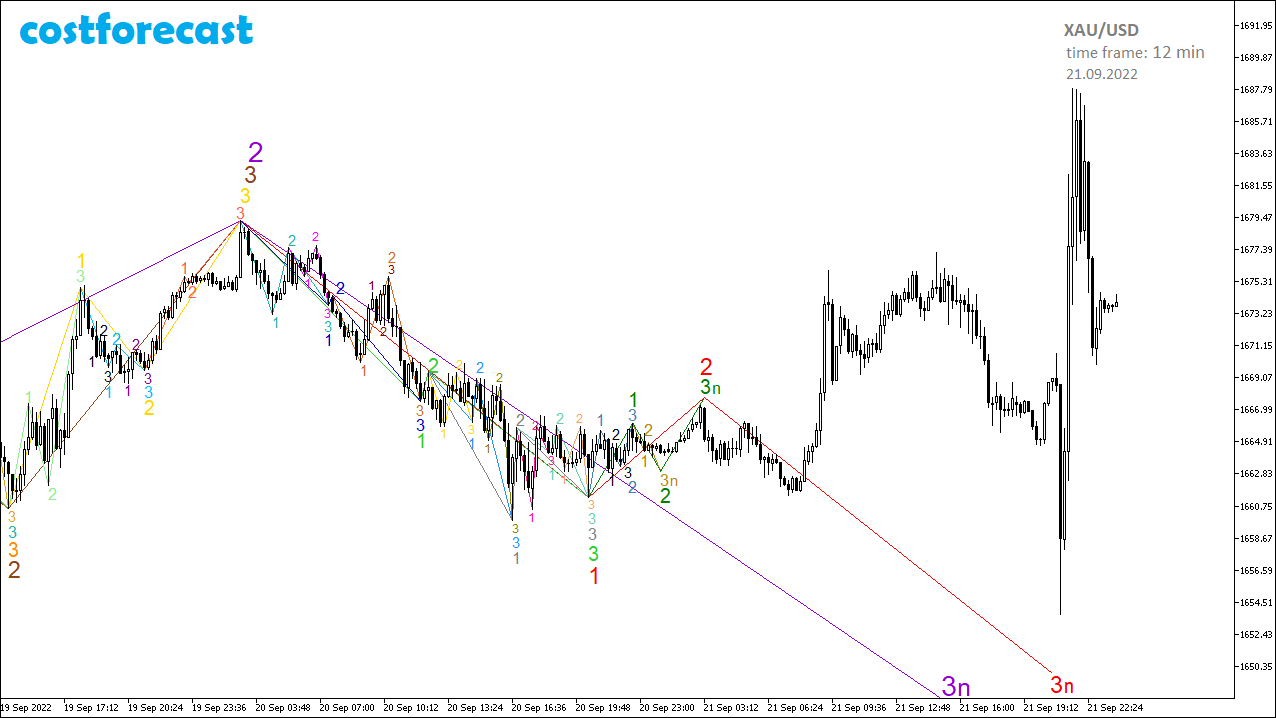
Gold, dynamics forecast from 09/21/2022.
The fractal structure of the chart with a time frame of 1 Hour.
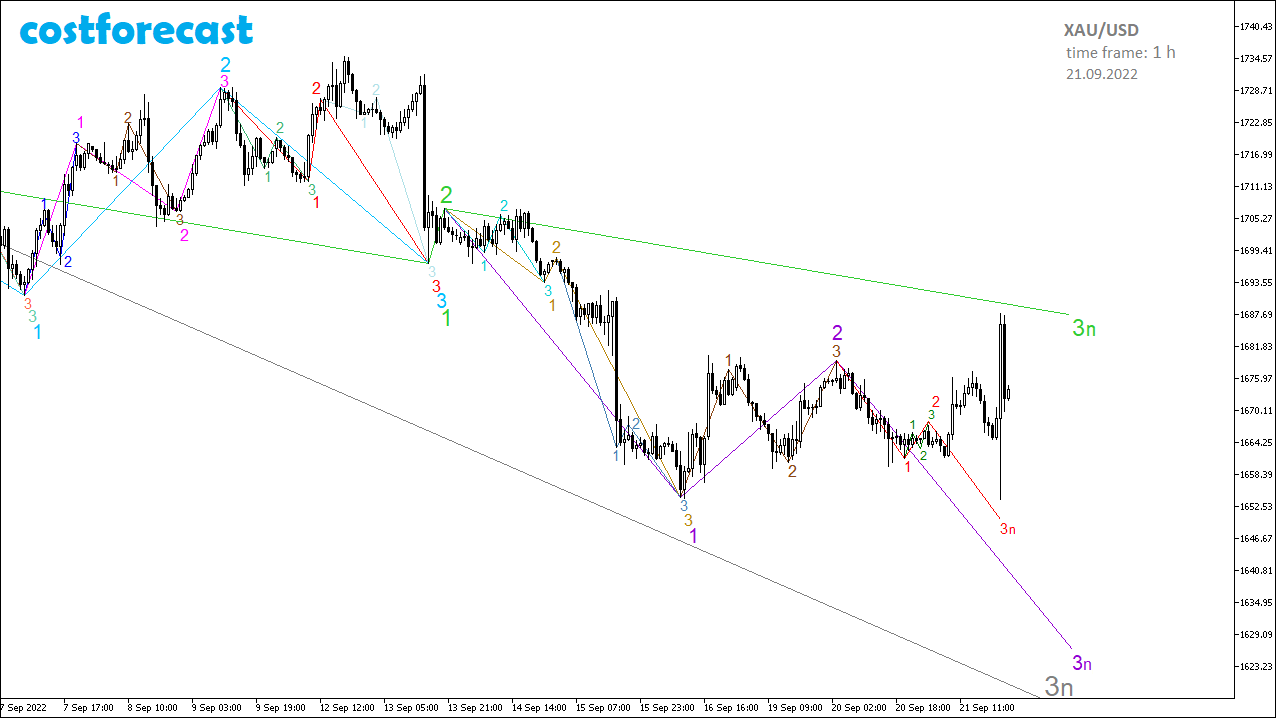
The existing fractal structure on the chart of the dynamics of the GOLD quotes, built with a time frame of 1 hour as of 09/21/2022, allows us to speak about the inconsistency of the assumption about the formation of a fractal, which is indicated in red and that at the point with coordinates (09/20/2022_03: 00; 1679.25) the 2nd segment of the purple fractal has not ended.
Gold, dynamics forecast from 09/21/2022.
The fractal structure of the chart with a time frame of 1 Hour.
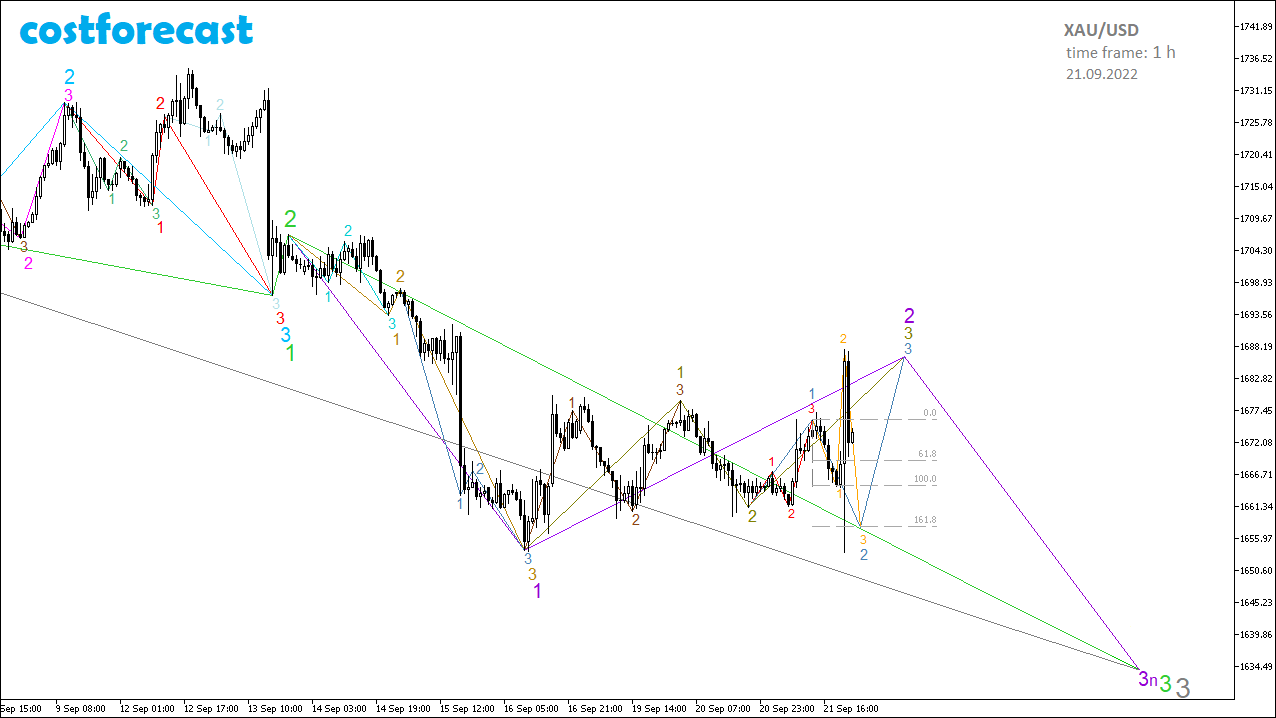
Analysis of the fractal structure of the chart of the dynamics of GOLD quotes, built with a time frame of 1 hour as of 09/21/2022, shows that the most likely scenario for the development of the chart is the continuation of the formation of the 3rd segment of the fractal, indicated in bright green with the beginning at the point with coordinates (09/13/2022_20:00; 1707.07). This bright green fractal represents the 3rd segment of the higher order fractal, marked in gray on the chart.
In this case, it can be assumed that the 3rd segment of a bright green fractal can form as a fractal of a lower order, indicated in purple, the 1st segment of which was formed on the time interval (09/13/2022_20:00; 09/16/2022_10:00) in the form of a light brown fractal, and the 2nd segment is in the process of formation and is indicated on the chart in olive color in the form of an F22 fractal.
The 1st segment of the olive fractal was formed on the time interval (09/16/2022_10:00; 09/20/2022_03:00) in the form of a brown fractal. The 2nd segment of the olive fractal was formed on the time interval (09/20/2022_03:00; 09/20/2022_20:00). The 3rd segment of the olive fractal is in the process of its formation.
At the moment, the dynamics of quotes is in the stage of formation of the F14 fractal, indicated in yellow, which is the 2nd segment of the higher-order fractal, indicated in pale blue, which is the 3rd segment of the olive fractal.
At the moment, it is most likely to expect a continuation of the lateral dynamics and the completion of the 2nd segment of the purple fractal, after which the downtrend will continue as part of the formation of the 3rd segment of the purple fractal.
Gold, dynamics forecast from 09/21/2022.
The fractal structure of the chart with a time frame of 12 minutes.
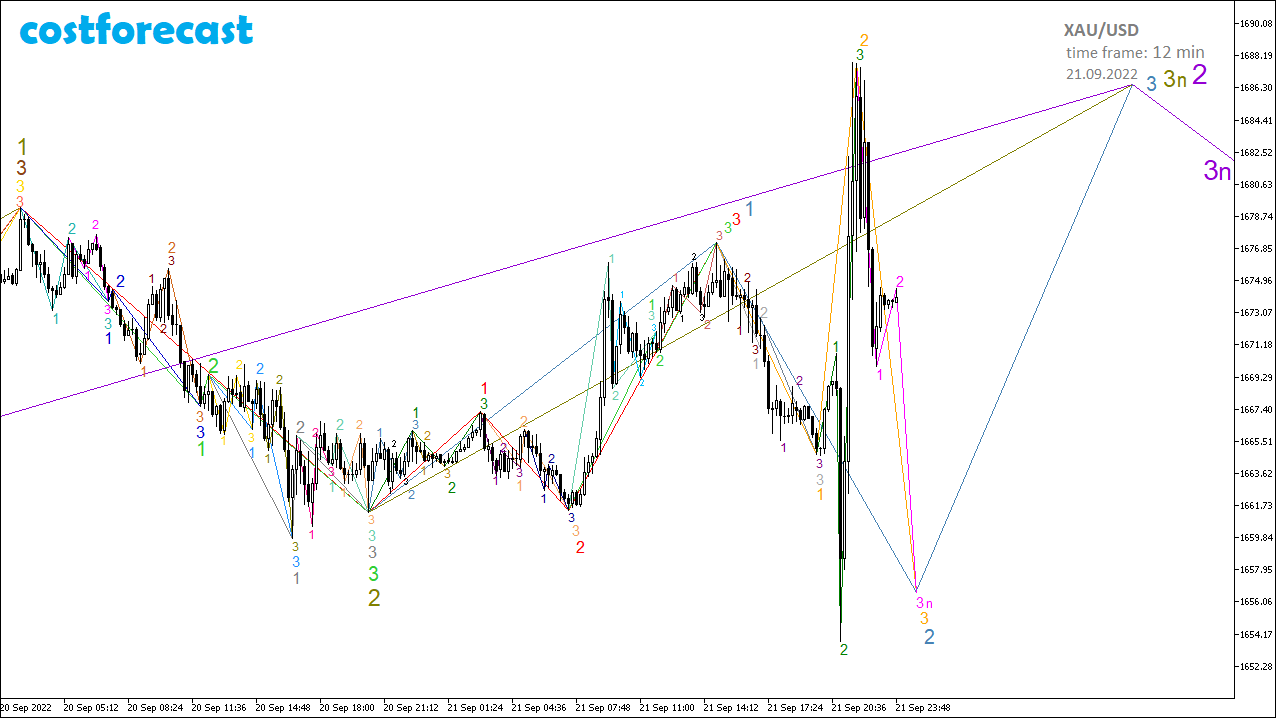
Taking into account the existing fractal structure on the chart of the dynamics of the GOLD quotes, built with a time frame of 12 minutes as of September 21, 2022 and taking into account the fractal structures of higher orders, we can assume that the current dynamics of the quotes is in the process of forming a fractal, indicated on the chart in yellow and being the 2nd segment of the higher order fractal, which is indicated in pale blue.
The most likely scenario is that the 3rd segment of the yellow fractal will form as a fractal of a smaller order, indicated in bright pink. The 1st segment of the yellow fractal was formed on the time interval (09/21/2022_14:48; 09/21/2022_19:48), and the 2nd segment - on the time interval (09/21/2022_19:48; 09/21/2022_21:48).
Gold, dynamics forecast from 09/22/2022.
The fractal structure of the chart with a time frame of 12 minutes.
Gold, dynamics forecast from 09/22/2022.
The fractal structure of the chart with a time frame of 12 minutes.
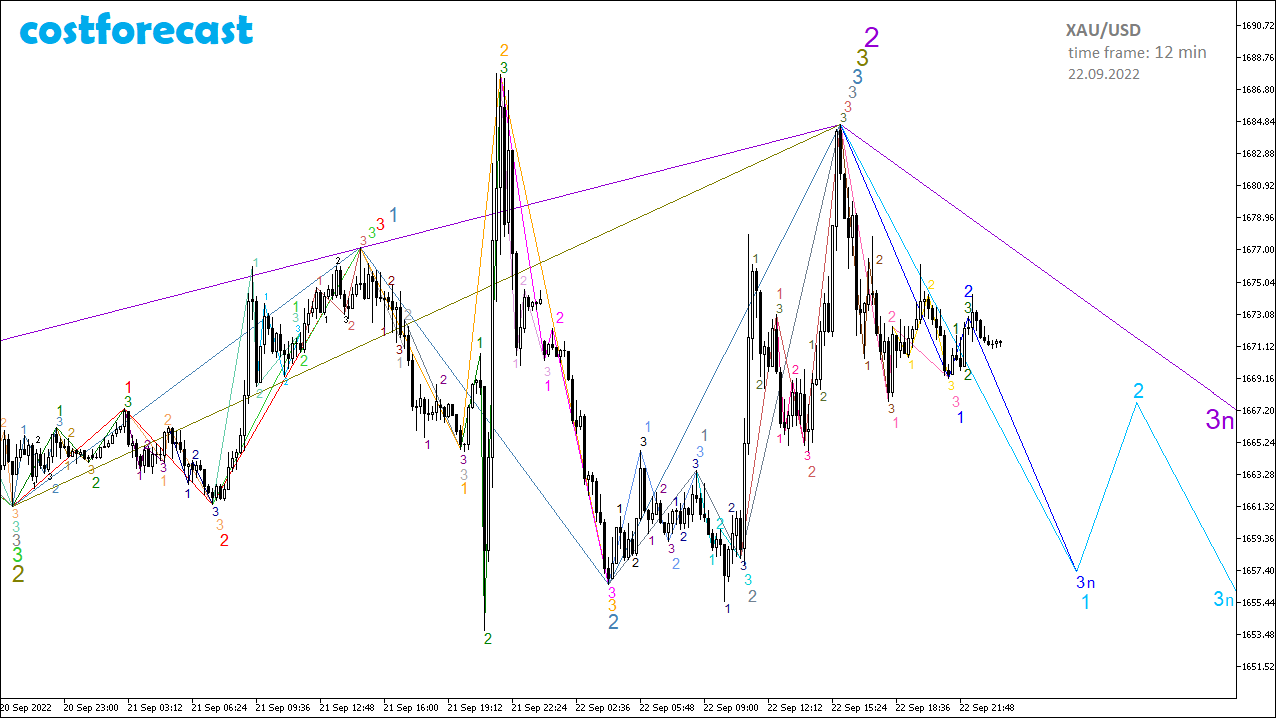
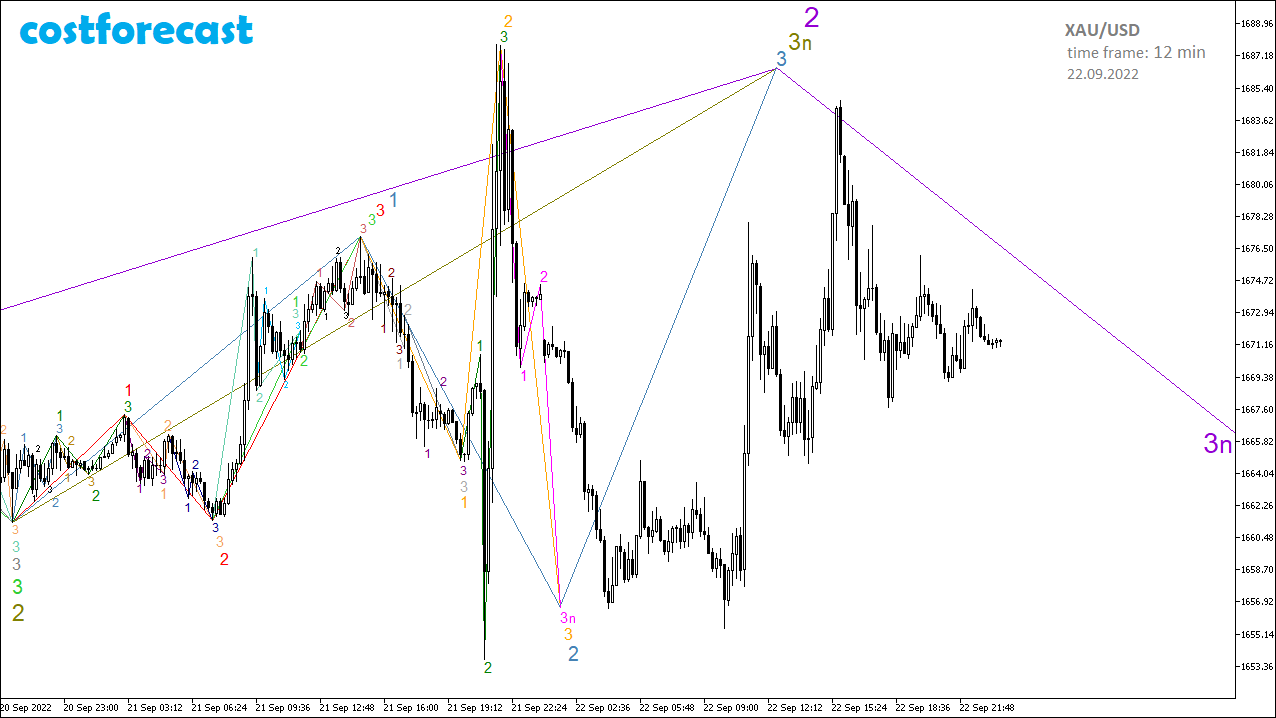
The existing fractal structure on the chart of the dynamics of quotations of Gold, built with a time frame of 12 minutes as of 09/22/2022, shows that on the time interval (09/20/2022_20:24; 09/22/2022_15:48) a pale blue fractal was completed, which is the 3rd segment of a higher order fractal, indicated in olive color, which in turn is the 2nd segment of an even higher order fractal, indicated in purple on the chart.
In this case, the downtrend that started at the point with coordinates (22.09.2022_15:48; 1684.70) will continue until the 3rd segment of the purple fractal is formed.
At the moment, it can be assumed that the dynamics of quotes is in the stage of formation of a fractal, which is indicated in blue and which, after its completion, will be the 1st segment of a larger fractal, indicated in blue.
Gold, dynamics forecast from 09/23/2022.
The fractal structure of the chart with a time frame of 12 minutes.
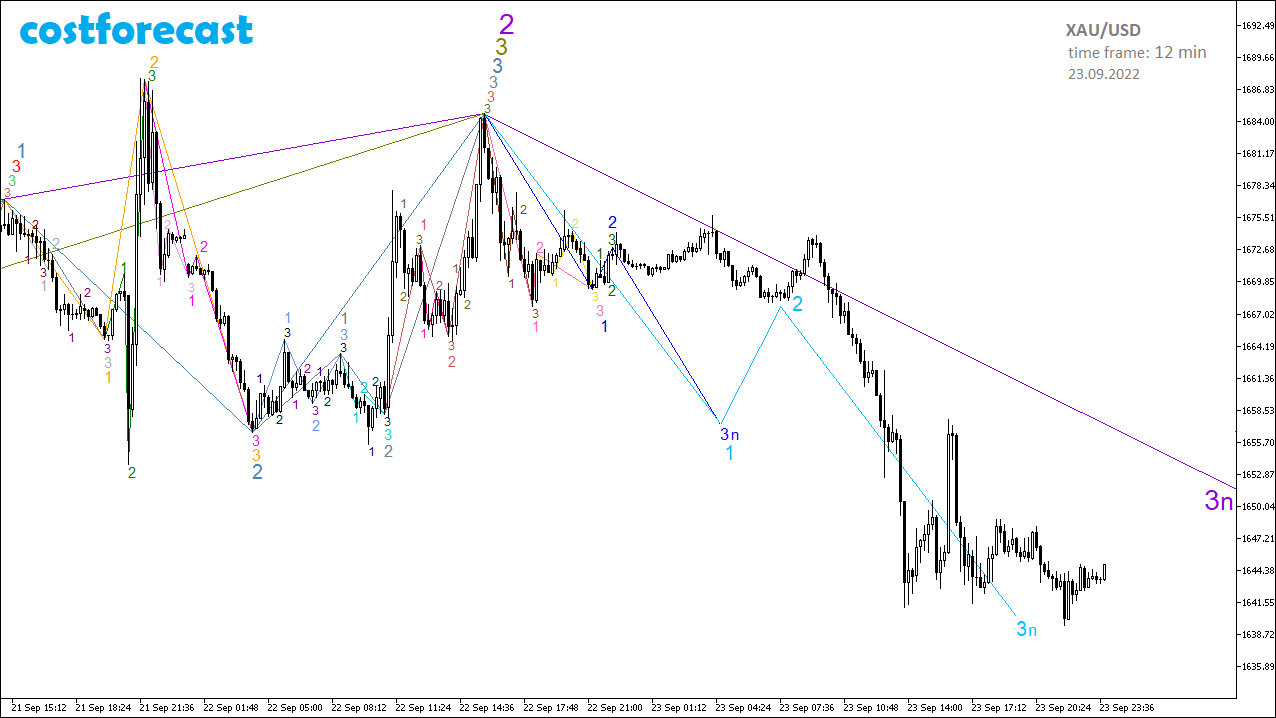
Gold, dynamics forecast from 09/23/2022.
The fractal structure of the chart with a time frame of 12 minutes.
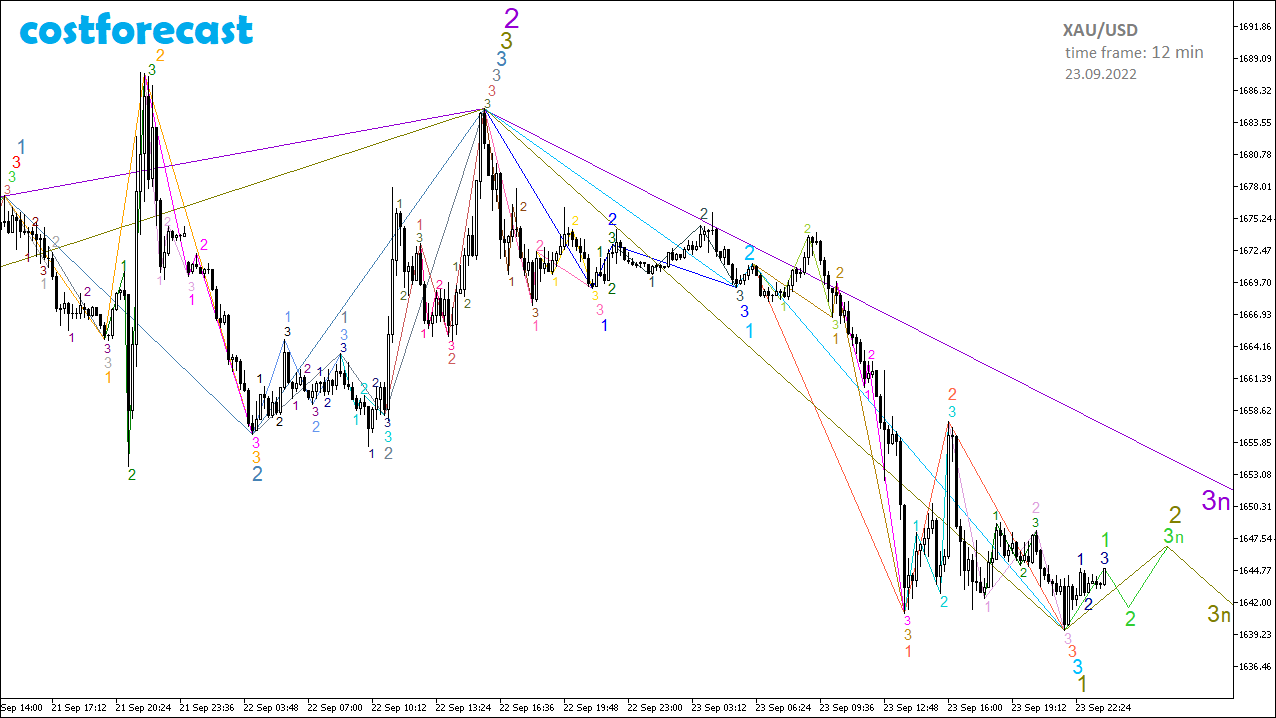
An analysis of the fractal structure of the graph of the dynamics of GOLD quotes, built with a time frame of 12 minutes as of 09/23/2022, allows us to say that at the point with coordinates (09/22/2022_15:48; 1684.70) the 3rd segment of the fractal began to form purple.
At the current moment, on the time interval (22.09.2022_15:48; 23.09.2022_21:48) the formation of the F11 fractal, indicated in blue, has occurred, which is the 1st segment of the fractal of a higher order, which is marked in olive color on the chart. The 3rd segment of the blue fractal is represented by the F33 fractal of a lower order of red color, which ended at the point with coordinates (23.09.2022_21:48; 1639.54).
Most likely, the future dynamics of quotations will take place within the framework of the formation of the 2nd segment of the olive fractal, indicated by the fractal of a smaller order F22 of bright green color, followed by the continuation of the downtrend within the formation of the 3rd segment of the olive fractal.


