
Daily, weekly and monthly Pivots points
Definition
In financial markets, a pivot point is a price level that is used by traders as a possible indicator of market movement. A pivot point is calculated as an average of significant prices (high, low, close) from the performance of a market in the prior trading period. If the market in the following period trades above the pivot point it is usually evaluated as a bullish sentiment, whereas trading below the pivot point is seen as bearish.
How to display daily pivots point in the chart ?
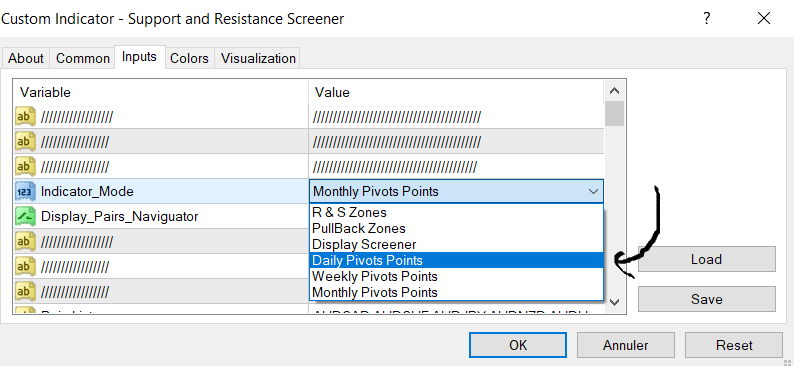
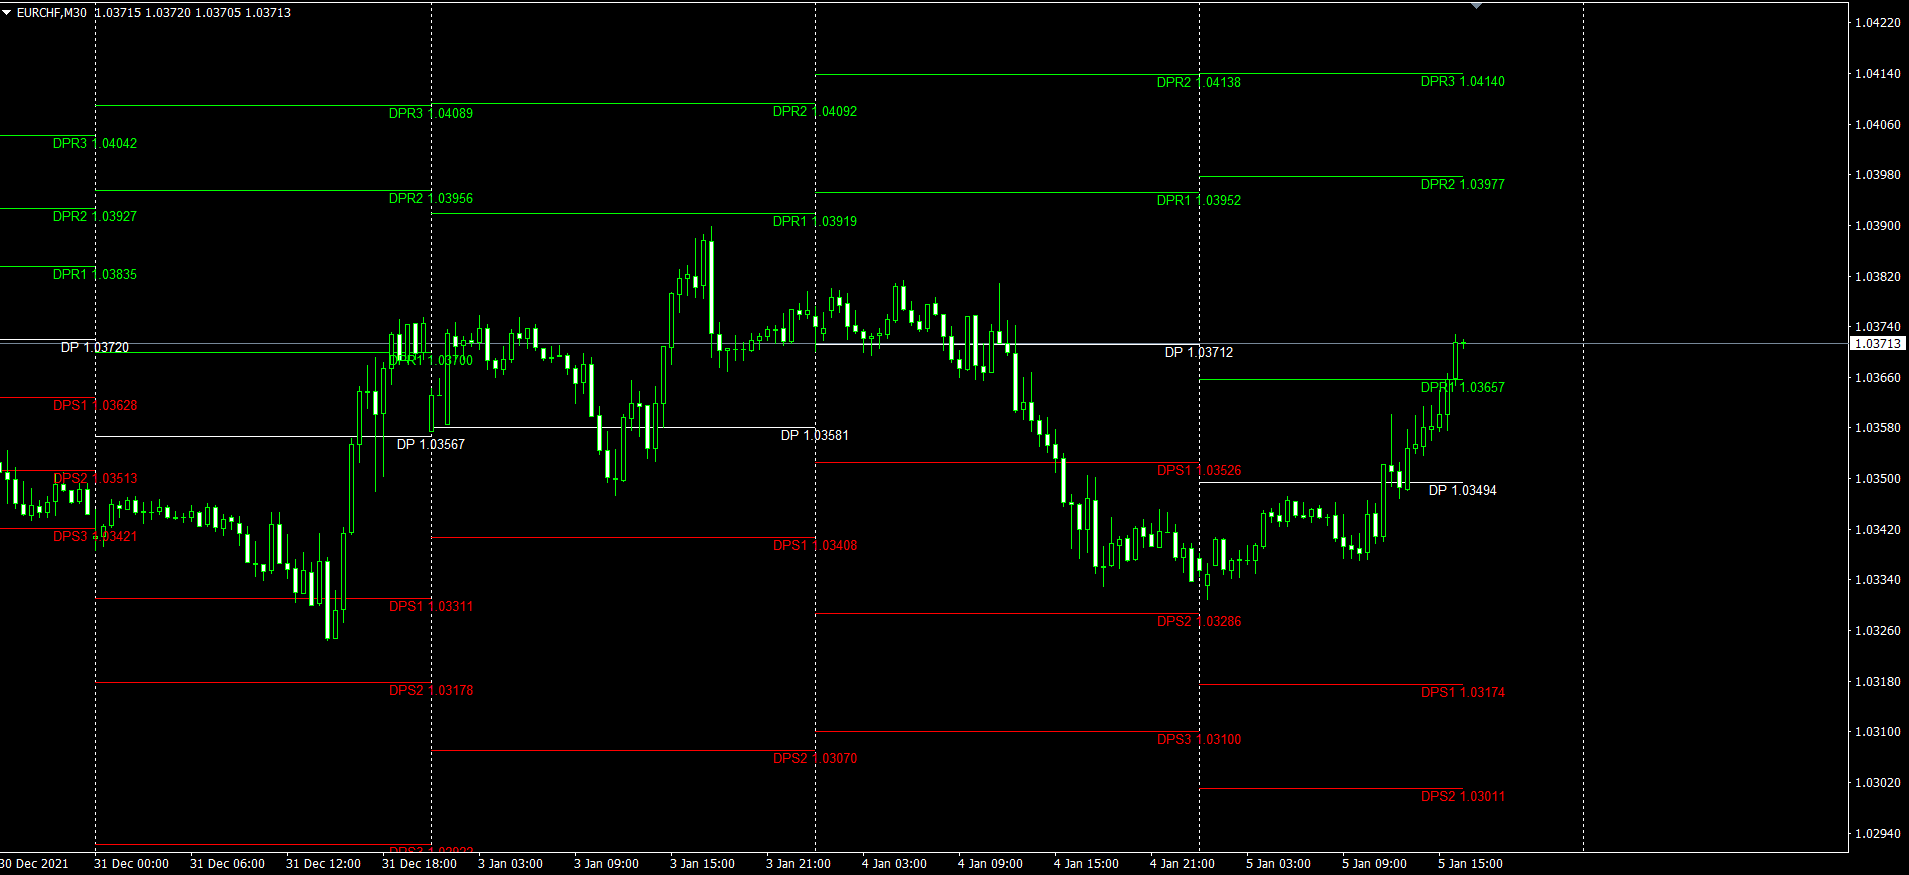
Daily Pivots points levels
How to display weekly pivots point in the chart ?
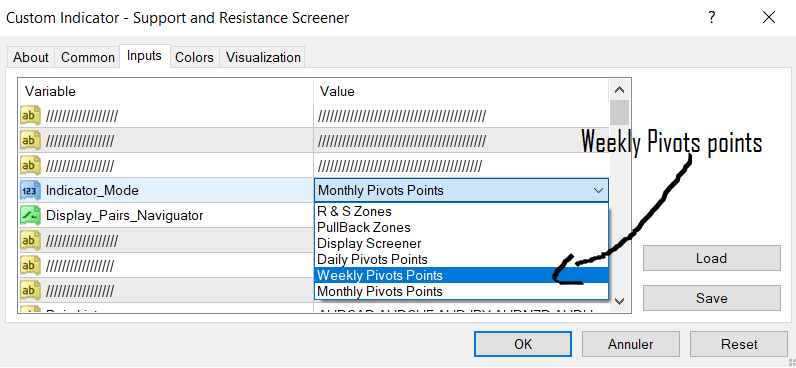
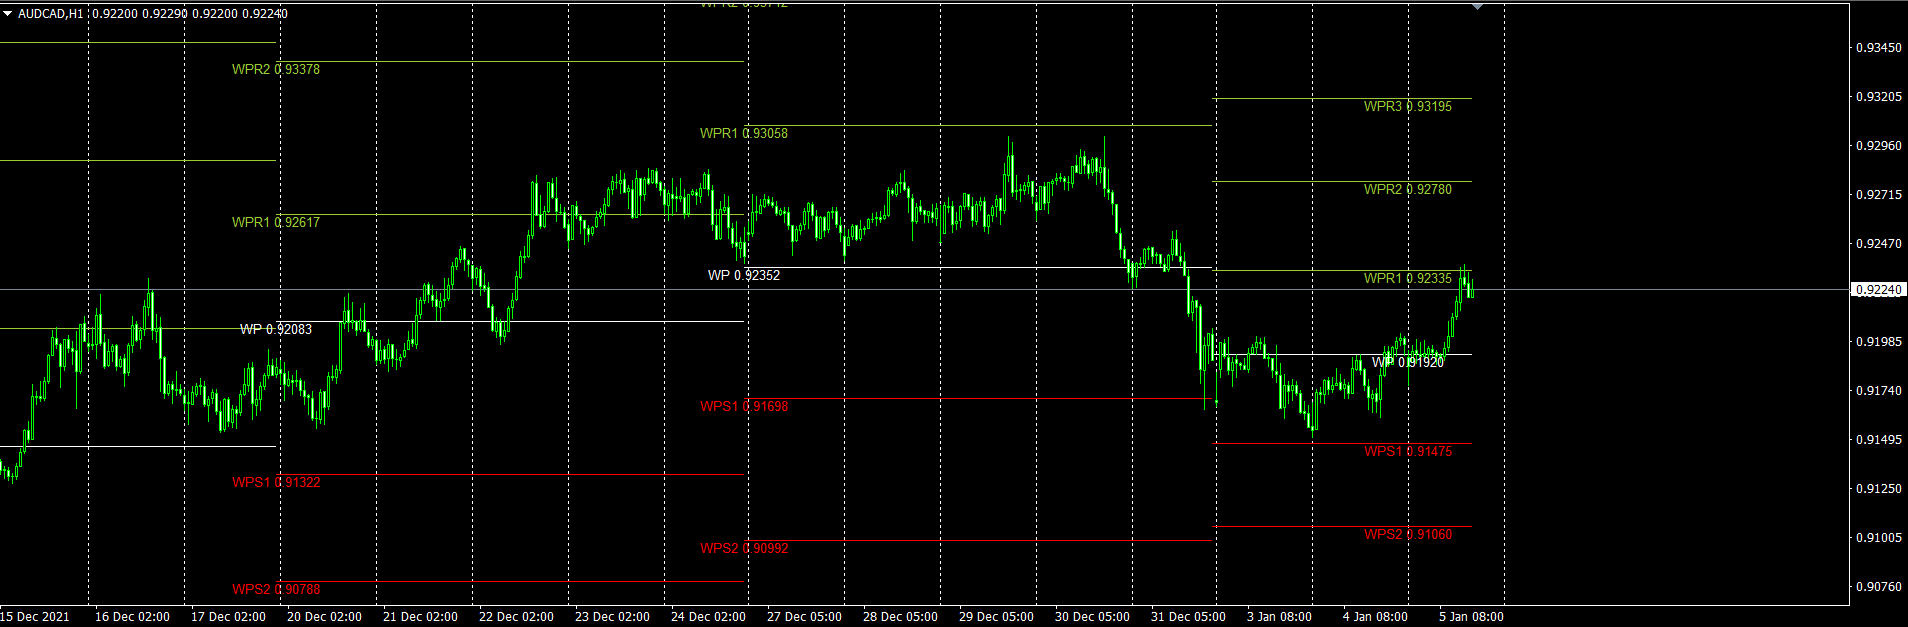
Weekly Pivots points levels
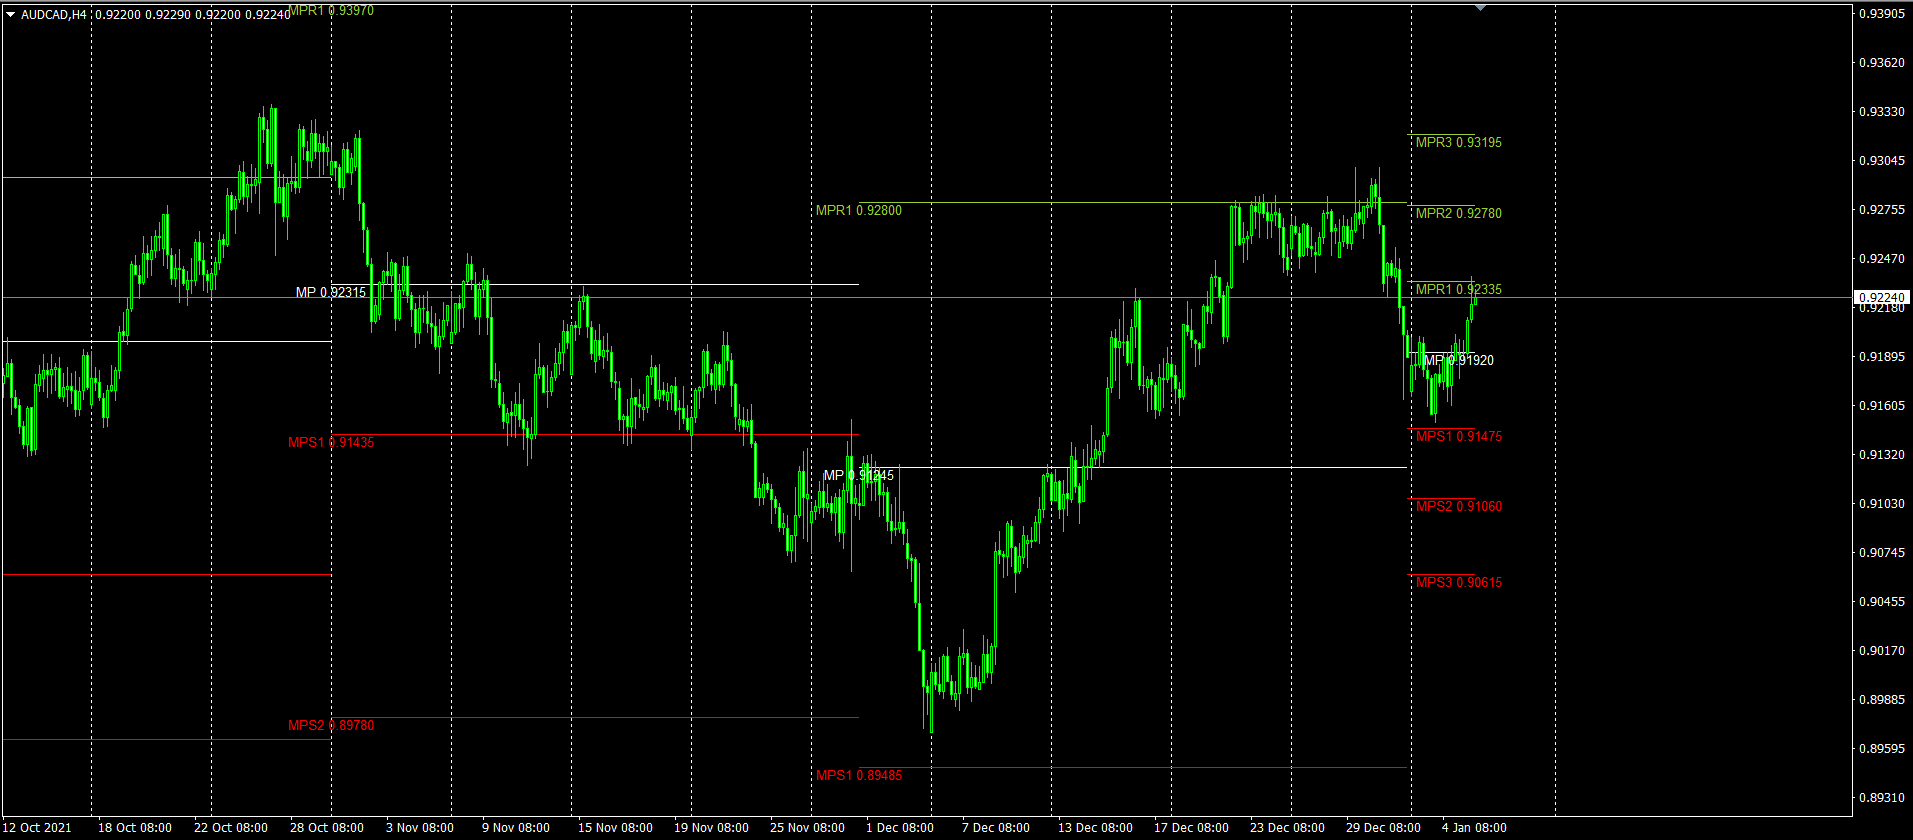
How to display monthly pivots point in the chart ?
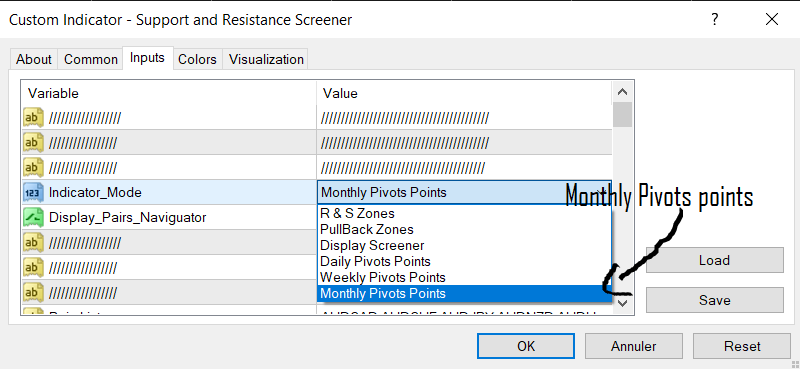
Monthly Pivots points levels
Please if you have any questions, feel free to post a comment or sending me a PM.
Author
SAYADI ACHREF , fintech software engineer and founder of Finansya.


")
![[XAUUSD]: Weekly Liquidity Activation Points (timings), June 22-26, 2026](https://c.mql5.com/6/1013/splash-preview-771790.png "[XAUUSD]: Weekly Liquidity Activation Points (timings), June 22-26, 2026")
