Daily analysis via Trend screener Indicator & Trend Line Map Indicator

My name is Ashref, a computer engineer and Founder of Finansya. I'm creating and coding trading systems and analytics tools for Metatrader both MT4 and MT5. I created this post in our blog to provide daily examples of using Trend Screener Indicator and Trend Line Map Indicator.
DOWNLOAD Trend Screener Indicator for MT4 & MT5
Click here for MT4 version : https://www.mql5.com/en/market/product/46303
Click here for MT5 version : https://www.mql5.com/en/market/product/47785
DOWNLOAD Trend Line MAP Indicator for MT4 & MT5
Click here for MT4 version : https://www.mql5.com/en/market/product/48086
Click here for MT5 version : https://www.mql5.com/en/market/product/51174
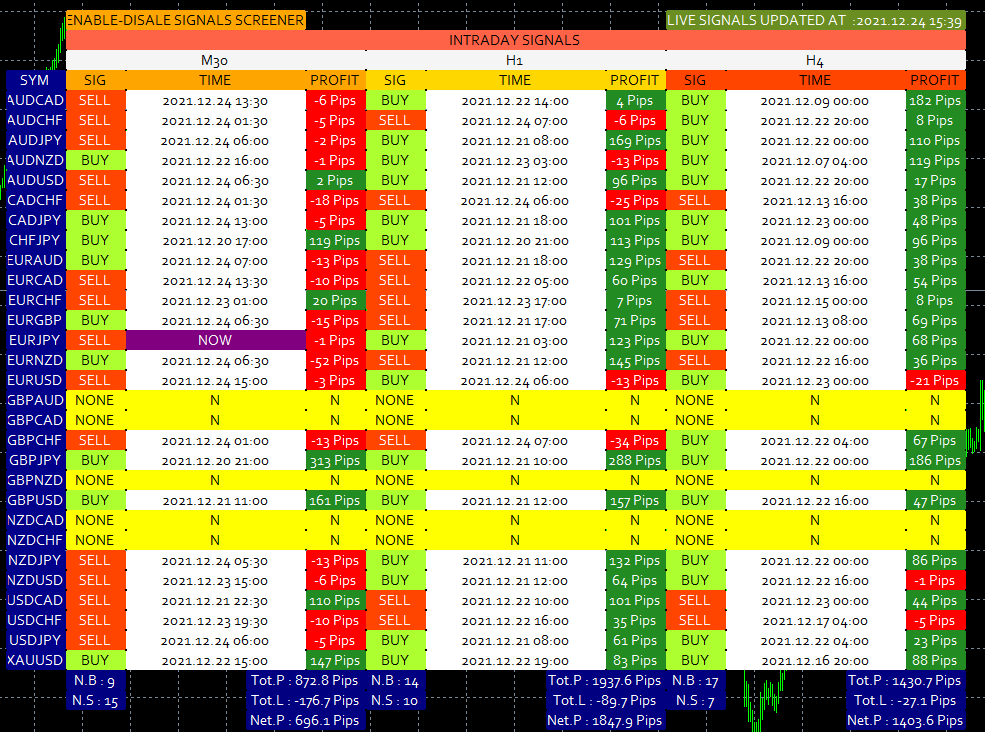
1. Entry signals performance Via Trend Line Map Indicator 24-12-2021
---- Trend Line Map indicator is an addon for Trend screener ----
Trend Line Map indicator is used to evaluate how many pips the price increased or decreased since the arrows appeared in the chart. ( Trend Screener Arrows )
Best signal : AUDCAD, H4 timeframe and with Profit : +182 pips.
Worst signal : EURUSD, H4 timeframe with loss : - 21 pips.
2. Trend Review Via Trend Screener Indicator, 24-12-2021. AUDUSD H1 timeframe.
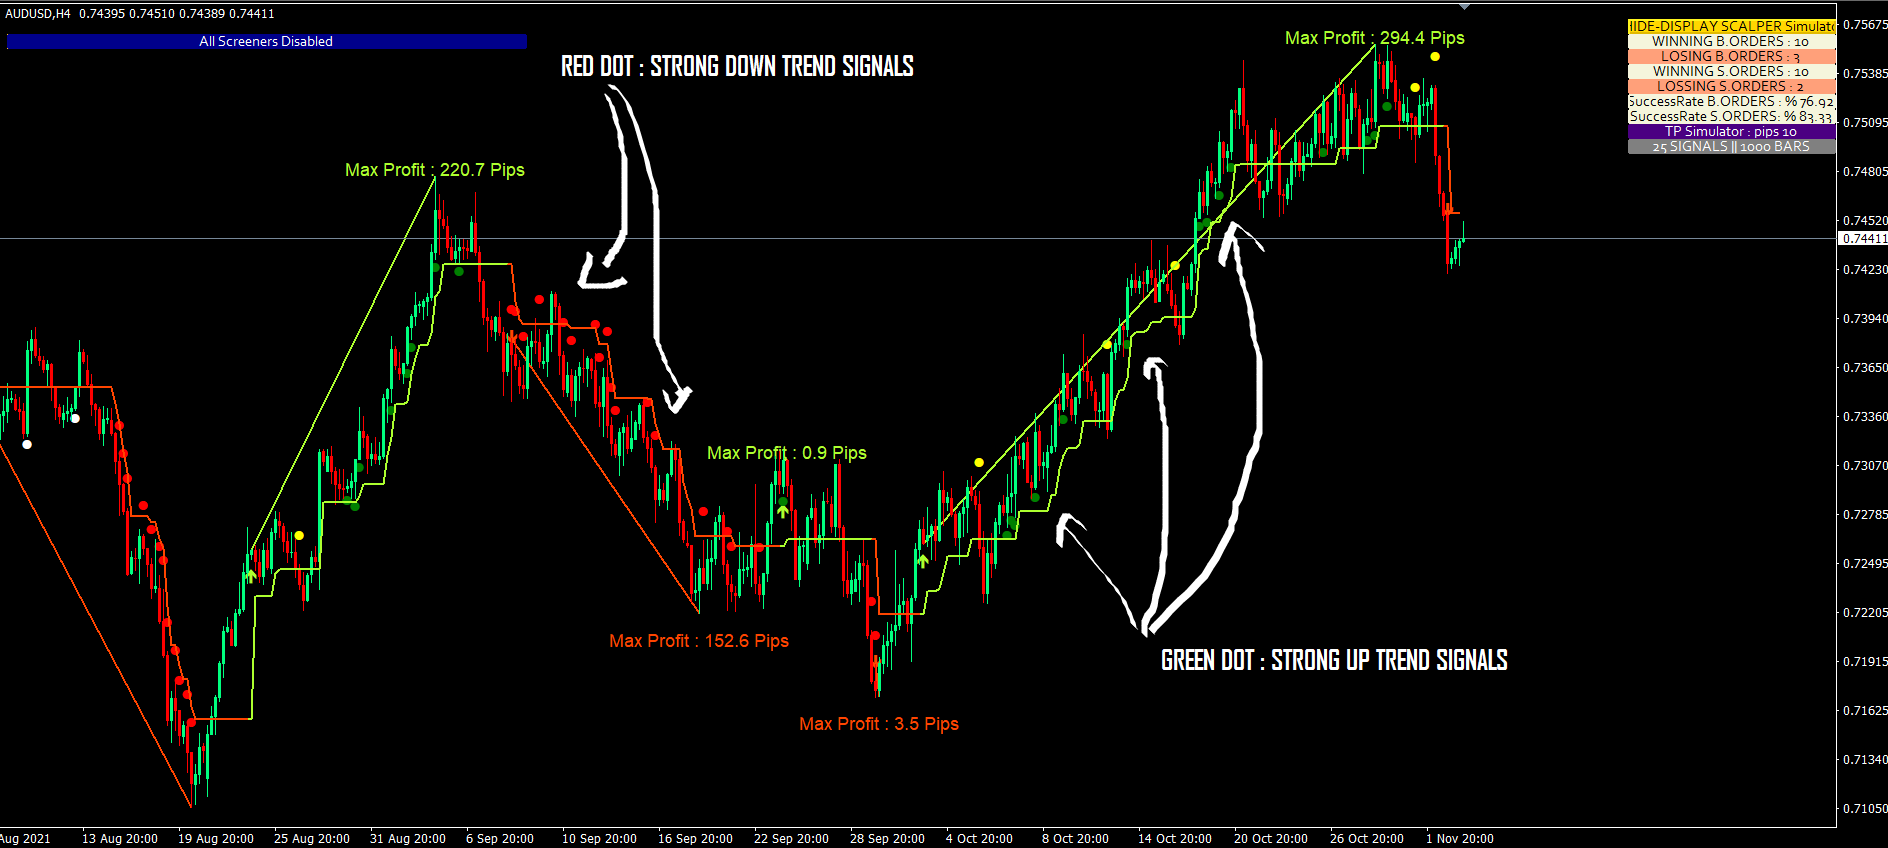
3. Forex Trend Signals via Trend Screener Indicator
The Trend Screener indicator will draw Dots signals in the charts where :
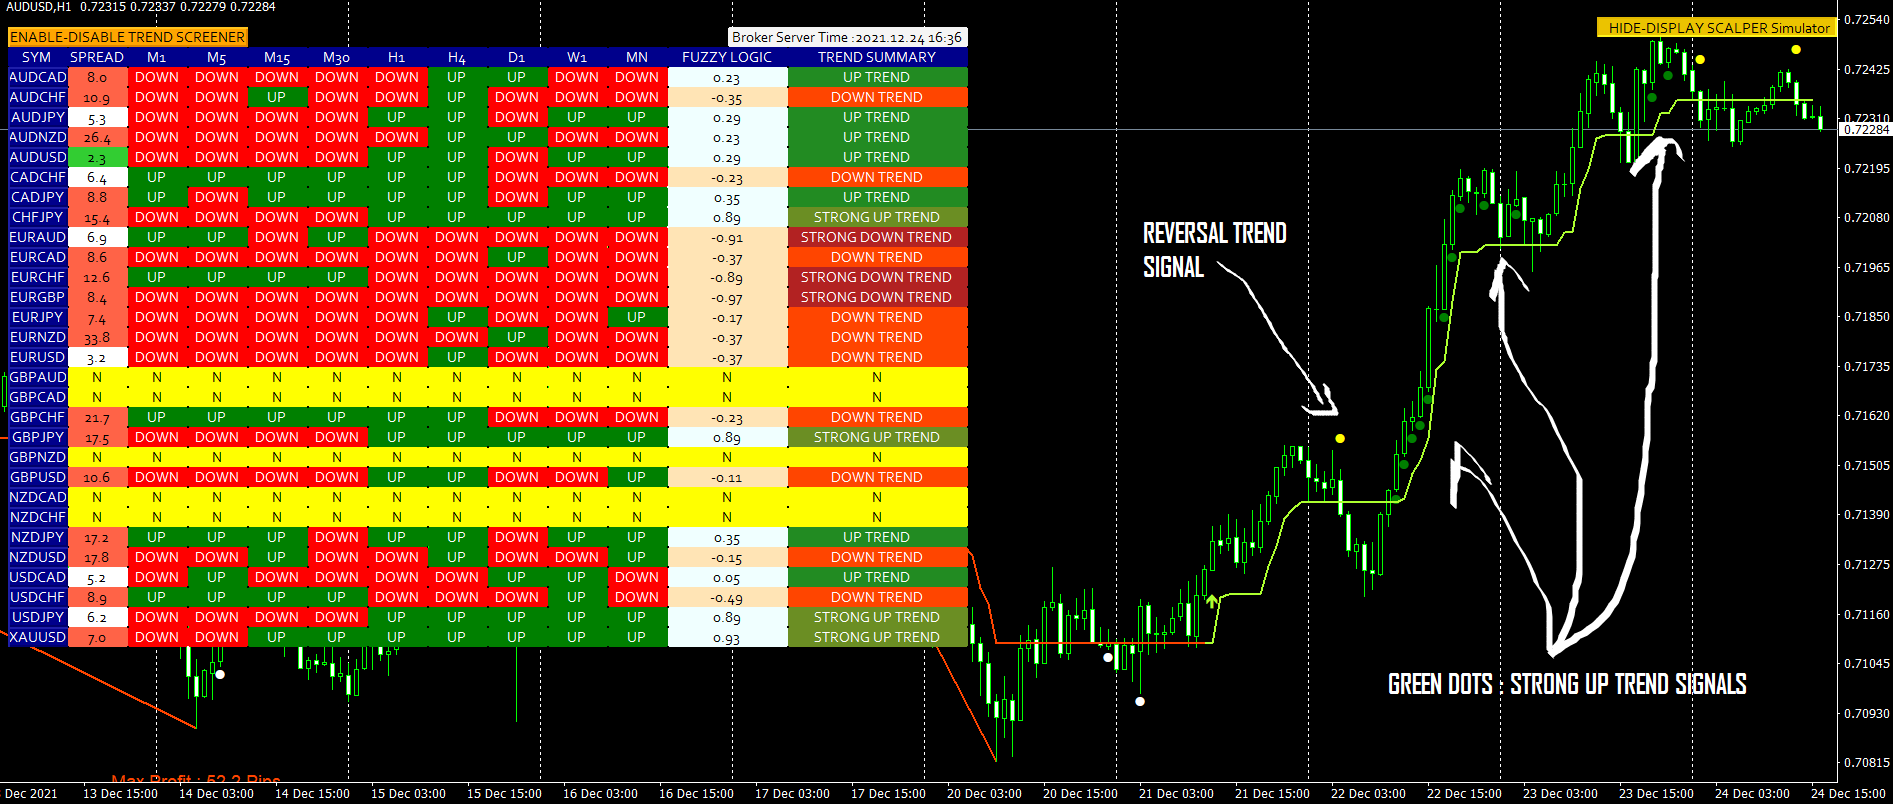
- Green Dots: Strong UpTrend Signals ( areas ) and the possibility of buy re-entries.
- Red Dots: Strong DownTrend Signals ( areas ) and the possibility of sell re-entries.
- White Dots: Trend Reversal Signals ( areas ) or Weak downtrend and risk of the trend change to Uptrend.
- Yellow Dots: Trend Reversal Signals ( areas ) or weak uptrend and risk of the trend change to downtrend.
If you have some questions or if you need help :
1. Contact me via Private Message.
Author
SAYADI ACHREF , fintech software engineer and founder of Finansya.


")
![[XAUUSD]: Weekly Liquidity Activation Points (timings), June 22-26, 2026](https://c.mql5.com/6/1013/splash-preview-771790.png "[XAUUSD]: Weekly Liquidity Activation Points (timings), June 22-26, 2026")
