

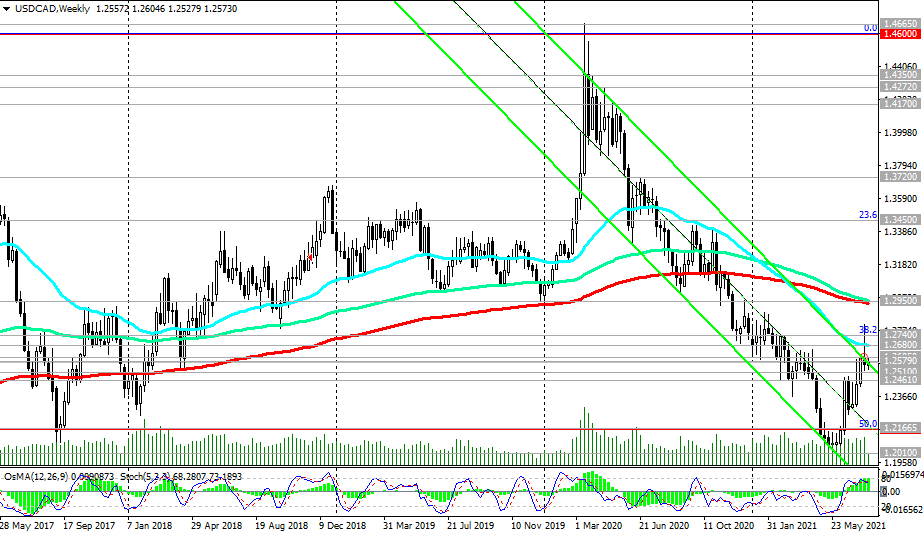
USD / CAD growth was stopped by resistance levels 1.2740 (Fibonacci level 38.2% of the downward correction in the wave of USD / CAD growth from 0.9700 to 1.4600), 1.2800.
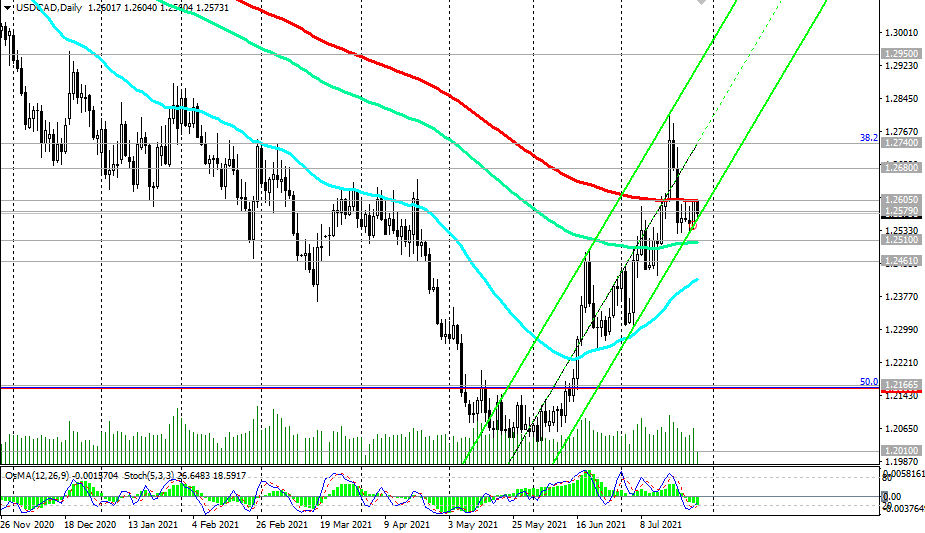
In case of breakdown of the support levels 1.2510, 1.2461 USD / CAD will go deep into the descending channel on the weekly chart and to the support levels 1.2165 (50% Fibonacci level), 1.2010 (2021 lows).
In an alternative scenario, a confirmed breakdown of the resistance levels 1.2740, 1.2800 will create preconditions for further growth of USD / CAD towards the resistance level of 1.2950, which will return USD / CAD to a long-term bull market (see also "Fundamental Analysis and Recommendations")
Sell Stop 1.2490. Stop-Loss 1.2615. Take-Profit 1.2460, 1.2440, 1.2275, 1.2165, 1.2100, 1.2010
Buy Stop 1.2615. Stop-Loss 1.2490. Take-Profit 1.2680, 1.2740, 1.2950
*) USD/CAD: Current Fundamental Analysis and Market Expectations
**) the most up-to-date "hot" analytics and trading recommendations (including entries into trades "by-the-market") - https://t.me/fxrealtrading


")
![[XAUUSD]: Weekly Liquidity Activation Points (timings), June 22-26, 2026](https://c.mql5.com/6/1013/splash-preview-771790.png "[XAUUSD]: Weekly Liquidity Activation Points (timings), June 22-26, 2026")
