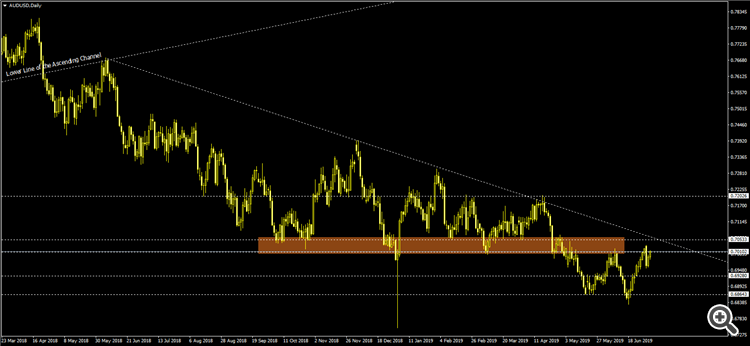
Beginning with June 07, 2018, the Australian dollar vs. the US dollar currency pair finds itself in a descending move that can be divided into three phases, each one with its own story to tell.
The first is limited by the confirmation as resistance of the lower line of the ascending channel that took place on June 07, 2018 - the line can
be drawn by joining the lows of January 20, 2016, and December 29, 2016, respectively - and the confirmation as support of the 0.7053 -
0.7010 area, marked by the rectangle. It represents only the departure from the previous trend. The second is a bearish triangle,
beginning on October 26, 2018, and ending August 5, 2019. What is interesting to note about it is the takuri on January 03, 2019, which
serves as evidence of the bullish determination to guard the 0.6900 psychological level. The third is in development and it reiterates
the bullish profile by means of the following points:
- The throwback that confirmed the 0.7053 - 0.7010 area as resistance on June 10, 2019, and that should have continued the expected decline way beyond the low of the takuri pattern, stalled at 0.6900.
- The bulls began their appreciation from 0.6900 in the form of a false break of the 0.6864 level, catalyzed by a bullish engulfing pattern on June 18, 2019, and maintained by a series of bullish candles.
- The resulting upwards movement made, on July 1, 2019, a new higher high - considering June 7, 2019 - and a bullish three-line strike pattern, both in a resistance area and signaling bullish conviction.
In these conditions, any movement to the south represents an opportunity for the bulls. The piercing of the double resistance, represented by the 0.7053 - 0.7010 area and the trendline, will open the door to 0.7200.
To wrap it up, being such an important weekly area, it can be said that the bears bit more than they could chew.


