
Forex Market Research and Analysis using 'Belkaglazer Researcher' tool
Belkaglazer Researcher is a freeware soft that allows you to do some studies of the FX market. This tool may give you ideas for creating your own trading strategy.
System Requirements | Download
First, you need to load historical data. The application requires MT4 data of M1 timeframe.
How to import the historical data into Belkaglazer Researcher
The data loading might take a few minutes. The 'Researcher' automatically calculates the most popular timeframes (M1, M5, M10, M15, M30, H1, H2, H4, D1) from 1-minute data. The 'Research (F5)' button will become active once the data file is loaded.
Settings
| If you want to... | Do this... |
|---|---|
| Identify a specific starting/ending date for historical data | Select a time span, choose a starting/ending date:
|
| Change timeframe | Select a specific timeframe from the list box:
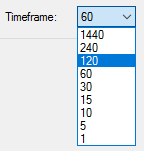
|
| Export historical data of the selected timeframe to a CSV file (you can convert historical data from M1 to any timeframe) | Click the 'Save' button:
|
| Apply filters to historical data | Click the 'Filter' button:
|
| Run a research | Click the 'Research (F5)' button:
|
Studies
1. Distribution of returns
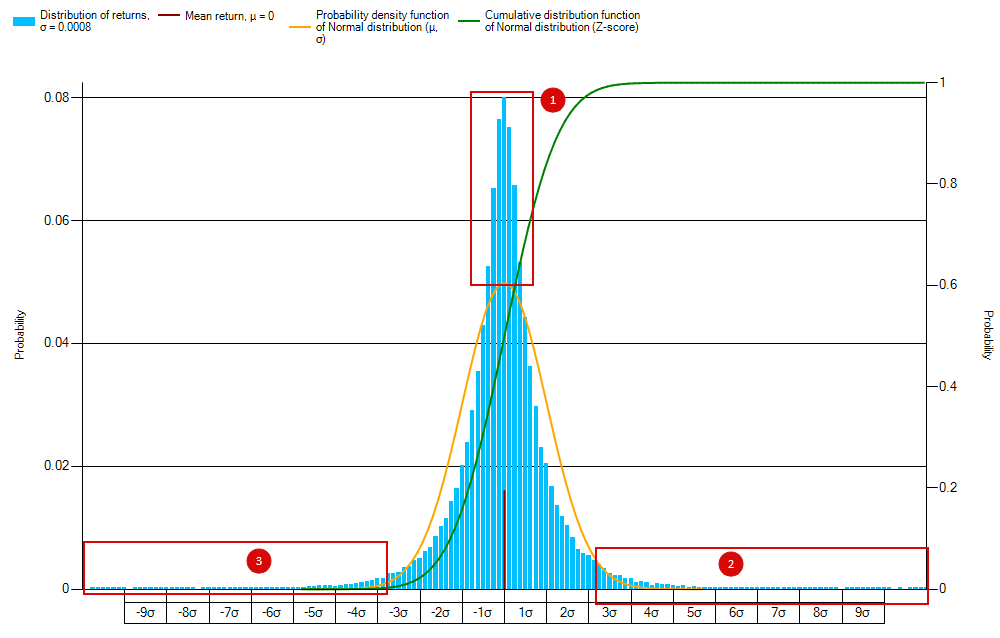
This research shows that the real distribution of price returns (changes) does not follow a normal distribution. Standard deviation (σ) is a measure of how spread out returns are from the average value. Mean (μ) is the simple average of the price returns.
Figure 1: Distribution of returns. The price returns have a heavy-tailed (2,3) and highly-peaked (1) nature of distribution: Any momentum strategy is based on the tails; a mean-reversion strategy uses the peaks.
2. Intraday seasonality in volatility
This research illustrates the intraday seasonal patterns in volatility within an hour or day.
Figure 2: Average hourly volatility (New York Close 5-day Charts)
Average hourly volatility can be
used to predict potential amplitudes of hourly price movements. The diagram displays regularities/trends in intraday volatility. The
regularities are based on steady factors, such as opening/closing hours of the biggest financial centers or the hours at which various
countries release important economic news. Different currency pairs are actively traded at different times of the day.
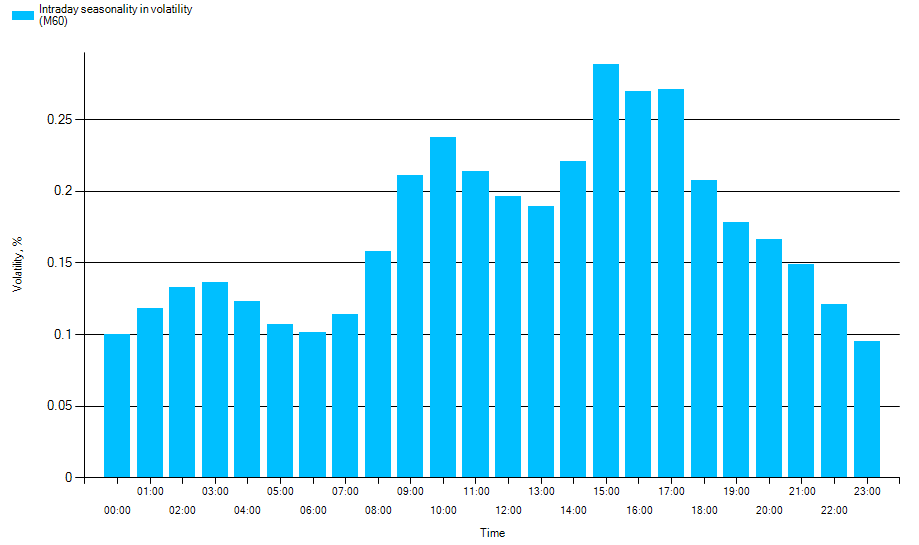
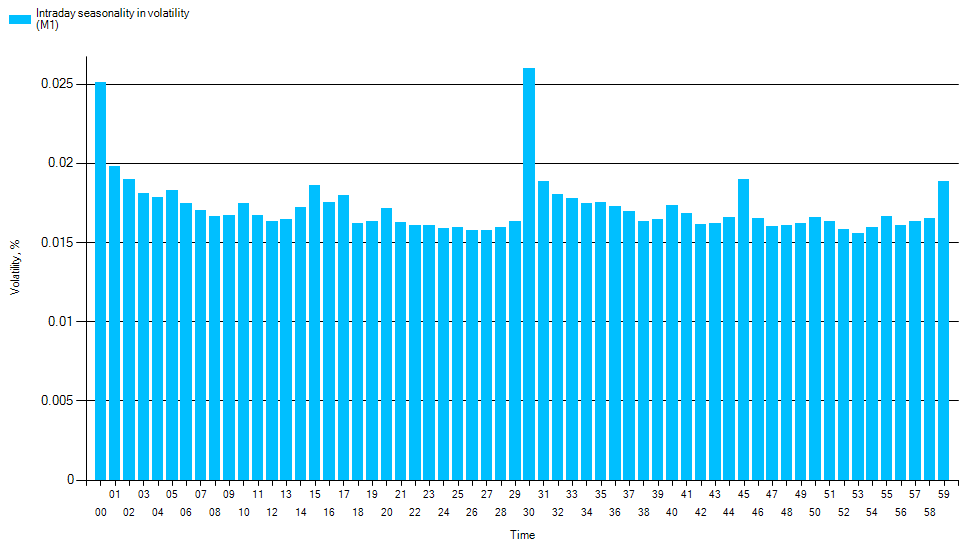
Figure 3: Volatility during an hour
Take notice of the
volatility outbursts within
0-15-30-45-59 minutes. These outbursts are caused by the fact that most robots/traders use standard
M15, M30, H1 timeframes.
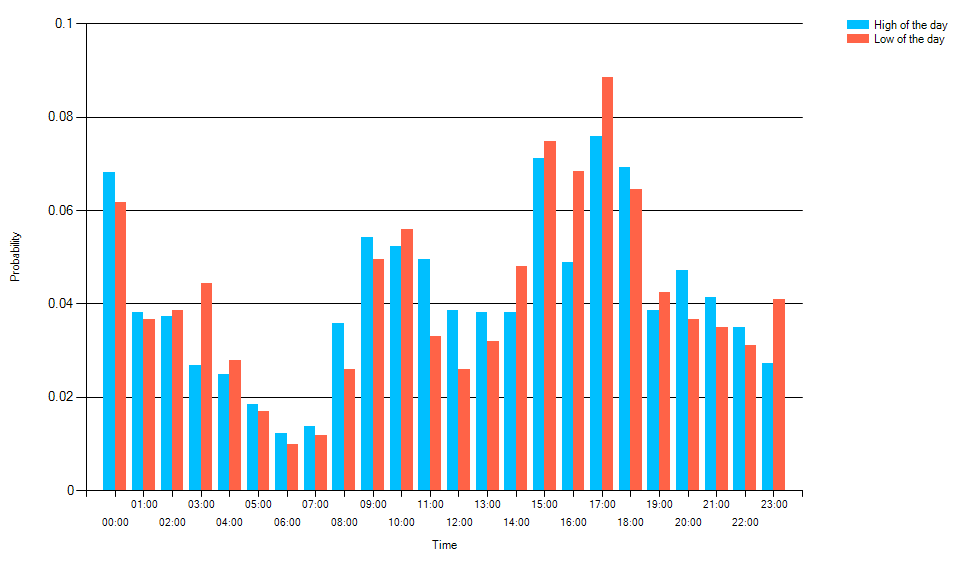
3. High / Low of the day
The initial goal of this study is to find out when the high or low of the day will most probably occur.
Figure 4: High/Low of the day
This diagram can help estimate the probability that a trade will be successful in the
chosen direction. For example, if the price falls to the 'lower' level of the local range at a time when the minimum of the day is most
likely occurs, then it will be a great time to buy.
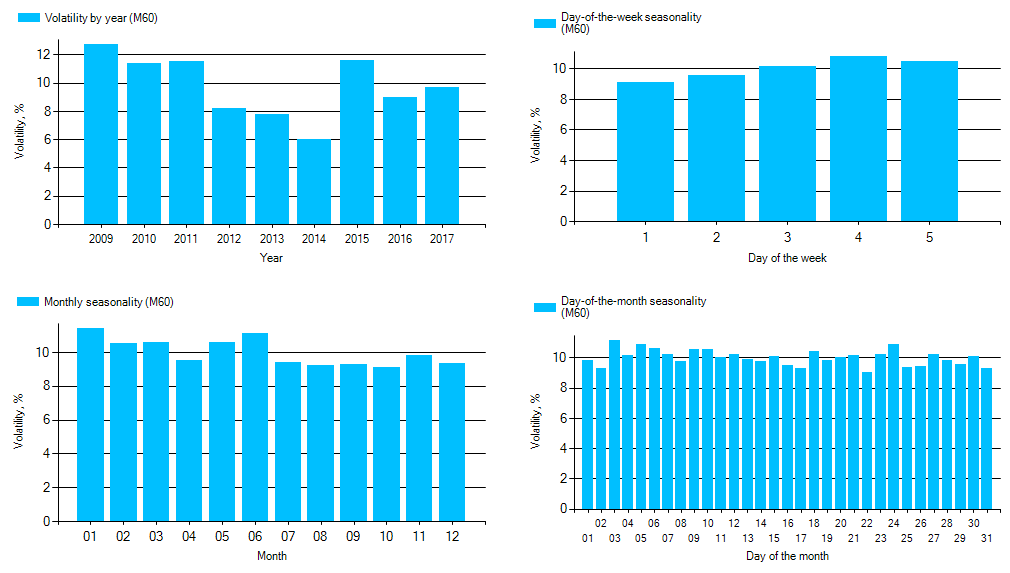
4. Weekly / monthly seasonality in volatility
The seasonality is an important factor in Forex trading. For example, volatility can narrow during Monday and expand during other days of the week. There is a fundamental difference in how some currency pairs behave during summer, winter, etc.
Figure 5: Weekly / monthly seasonality
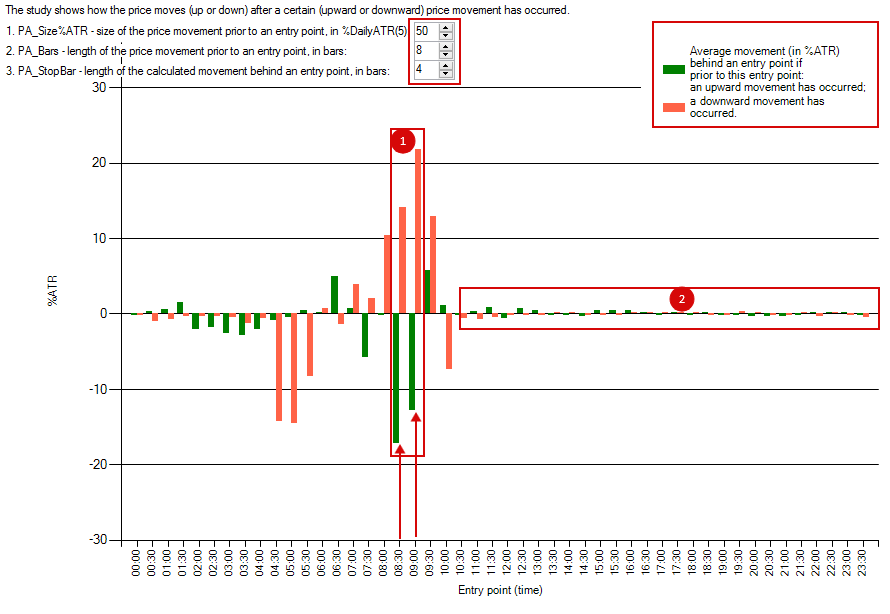
5. Price Action
The study shows how the price moves (up or down) after a certain (upward or downward) price movement. Let's look at an example with the EURUSD pair.
Figure 6: Mean reversion pattern during the first hours of the London FX Session (when the Forex market opens in
London)
- The green bar (1) at 8:30/9:00 am (New York Close 5-day Charts) shows that if for the previous 8 bars the upward price movement exceeds 50% of the daily ATR, then the price moves down (on average) by 17/13% over the next 4 bars.
- The red bar (1) at 8:30/9:00 am (New York Close 5-day Charts) shows that if for the previous 8 bars the downward price movement exceeds 50% of the daily ATR, then the price moves up (on average) by 14/22% over the next 4 bars.
- Take notice of the time after 10:30 (2). The lack of trends means that price movements after 10:30 do not depend on previous short-term price movements.
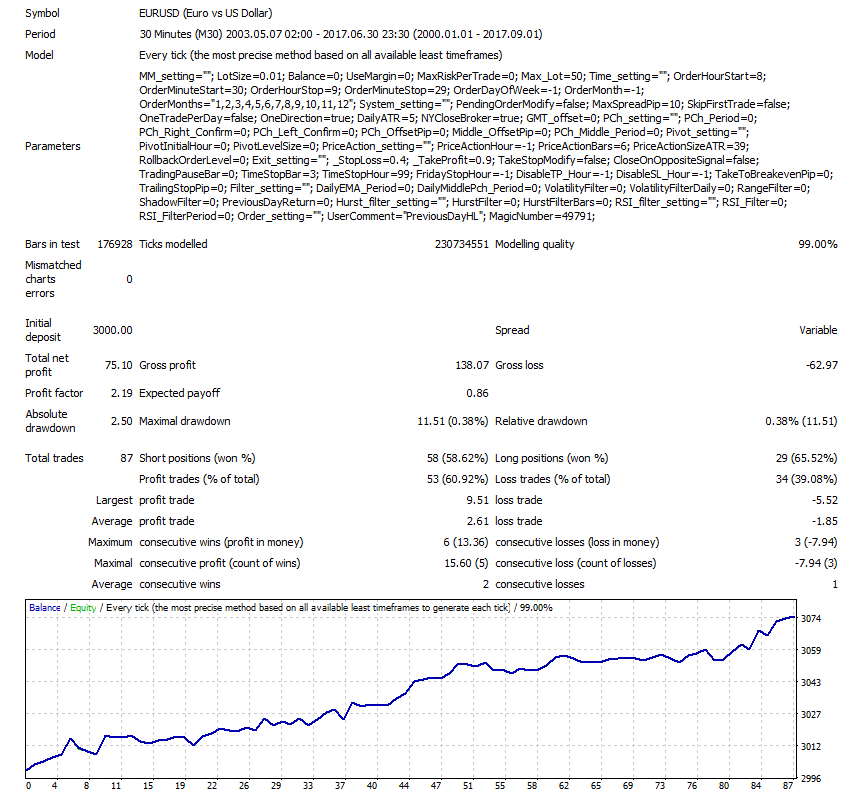
Let's try to test this simple pattern with Belkaglazer EA:


")
![[XAUUSD]: Weekly Liquidity Activation Points (timings), June 22-26, 2026](https://c.mql5.com/6/1013/splash-preview-771790.png "[XAUUSD]: Weekly Liquidity Activation Points (timings), June 22-26, 2026")
")