

After yesterday, marked by sluggish dynamics and low volumes, today we see an increase in volatility and the resumption of a decline in the US dollar.
The continuing tension in the Asia-Pacific region continues to stimulate purchases of assets-shelters, such as gold, yen, and franc.
There is also an increase in the prices of oil and other commodities, along with which the quotations of commodity currencies are growing.
The New Zealand dollar is also growing today against the US dollar, despite a number of fundamental factors. This is the continuing commitment of the RBNZ to conducting soft monetary policy, the uncertainty surrounding the elections in New Zealand scheduled for September 23, geopolitical tensions in the region due to the continuing provocations by North Korea against the US and Japan.
For a stable recovery in the New Zealand economy and rising inflation, "a lower New Zealand dollar rate is needed", the RBNZ said recently.
We are waiting for today data from the auction of dairy products, the publication of which is scheduled for the period after 14:00 (GMT). The price index for dairy products, prepared by Global Dairy Trade, came out last time with a value of -0.4%. If the prices for milk powder decrease again, it will have a negative impact on the New Zealand dollar.
*)An advanced fundamental analysis is available on the Tifia Forex Broker website at tifia.com/analytics
Support and resistance levels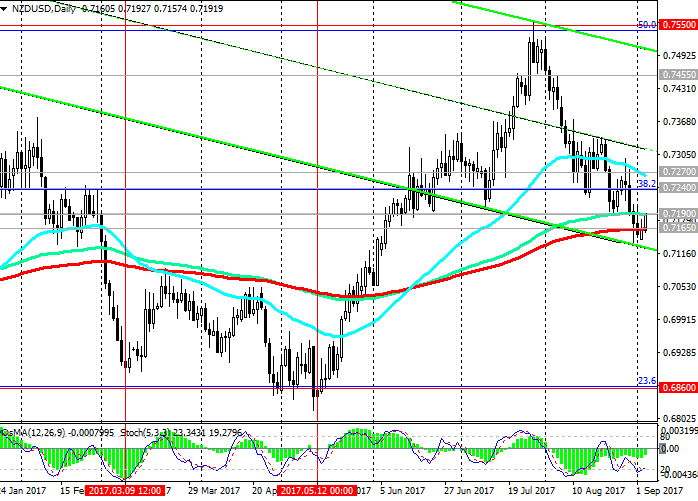
Today, NZD / USD is trading in the range between support levels of 0.7165 (EMA200), 0.7190 (EMA144 on the daily chart). A breakthrough in one direction or another may determine the direction of further medium-term movement of the NZD / USD pair.
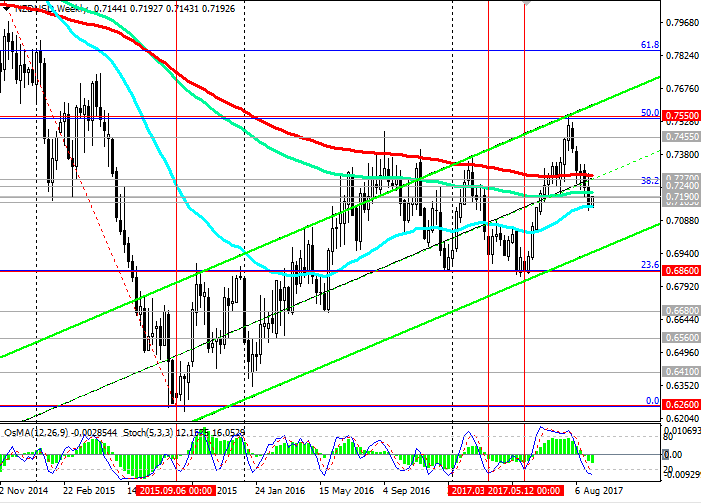
The fastening above the levels of 0.7240 (the Fibonacci level of 38.2% of the upward correction to the global wave of decline of the pair from the level of 0.8800, which began in July 2014, the minimums of December 2016), 0.7270 (EMA200 on 4-hour, weekly charts) will confirm the return of the upward dynamics.
In the alternative scenario and in case of a breakdown of the level 0.7165, a further decline to the support levels 0.6860 (Fibonacci level of 23.6% and the lower limit of the range located between the levels of 0.7550 and 0.6860) is possible. A break at the level of 0.6860 will mean the end of the upward correction, which began in September 2015, and a return to the downward trend.
Indicators OsMA and Stochastics on the daily, weekly charts recommend short positions.
Support level: 0.7165
Resistance levels: 0.7190, 0.7240, 0.7270, 0.7300, 0.7320, 0.7455, 0.7500, 0.7550
Trading Scenarios
Sell Stop 0.7170. Stop-Loss 0.7210. Take-Profit 0.7160, 0.7100, 0.7000, 0.6860
Buy Stop 0.7210. Stop-Loss 0.7170. Take-Profit 0.7240, 0.7270, 0.7300, 0.7320, 0.7455, 0.7500, 0.7550
*) For up-to-date and detailed analytics and news on the forex market visit Tifia Forex Broker website tifia.com


")
