

COT-Most Selling by AUD Speculators Since 2013
- Biggest 1 week selling by AUD speculators since 2013
- Record ownership profile in MXN
- Record open interest in silver
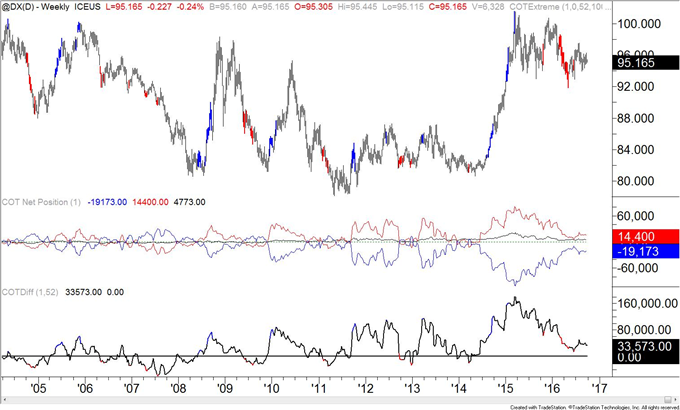
The COT Index is the difference between net speculative positioning and net commercial positioning measured. A blue colored bar indicates that the difference in positioning is the greatest it has been in 52 weeks (bullish) with speculators selling and commercials buying. A red colored bar indicates that the difference in positioning is the greatest it has been in 52 weeks (bearish) with speculators buying and commercials selling. Non-commercials tend to be on the wrong side at the turn and commercials the correct side. Use of the index is covered closely in detail in my book.
Latest CFTC Release dated September 20, 2016
Week (Data for Tuesdays) | 52 week Percentile |
28 | |
47 | |
22 | |
Australian Dollar | 57 |
71 | |
65 | |
80 | |
Mexican Peso | 0 |
67 | |
Silver | 80 |
69 | |
Crude | 55 |
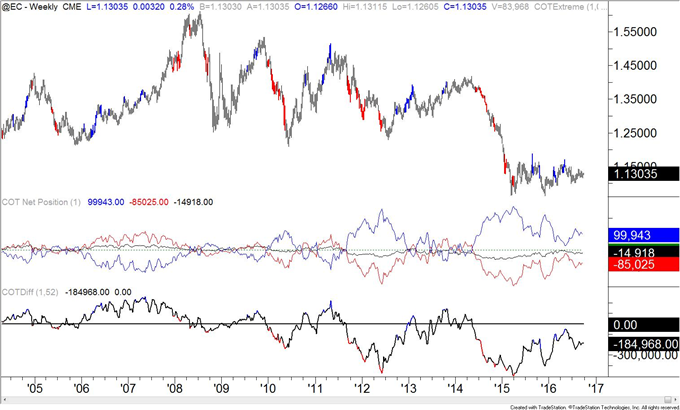
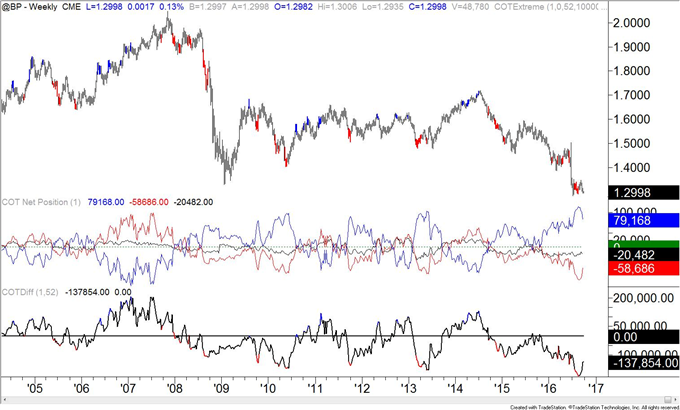
Charts (all charts are continuous contract)
Non Commercials (speculators) – Red
Commercials – Blue
Small Speculators – Black
COTDiff (COT Index) – Black
US Dollar ICEUS Continuous Contract
Euro CME Continuous Contract
British Pound CME Continuous Contract
continue?


")
![[XAUUSD]: Weekly Liquidity Activation Points (timings), June 22-26, 2026](https://c.mql5.com/6/1013/splash-preview-771790.png "[XAUUSD]: Weekly Liquidity Activation Points (timings), June 22-26, 2026")
