
This post is a translated description for OandaX OrderBook Chart indicator.
You can download it here: https://www.mql5.com/ru/code/15993
This code is an example that shows data format for the OandaX histogram. Also it can be useful if you want to know ho to work with the histogram data, because the data supplied by OANDA is pretty rude - it's disordered and can omit levels. In addition, we store them in binary format to save space and traffic.
That's how it looks
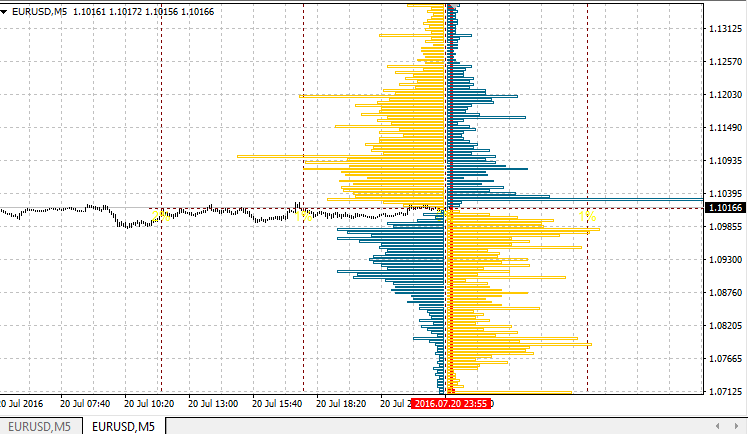
Indicator OandaX OrderBook Chart is designed to display a histogram of historical orders or positions of the instrument closest the time specified by the user in the chart (you can specify it by moving the vertical line). For the continuous updating of data you should have OandaX Download Manager running in the terminal. To display the data that has been already downloaded there is no need to have the manager running.
The indicator adjusts the histogram using chart price and time scales. This means that in contrast to the indicator OandaX OrderBook Image History the histogram will be drawn not in the place the user wants to, but directly at the place of the chart, for which data is loaded. So it can draw outside the visible part of the chart, and it can take some time to find it on the chart.
If the vertical line is placed at 0th bar or to the right (in the future), the line will automatically move to the right when a new bar appears, this is done in order to be able to constantly monitor the latest data downloaded.
The indicator can display the following data:
- Orderbook. It is a histogram that shows the distribution of limit and stop orders on price levels. Limit orders are Buy and Sell Limits and Take Profits . Stop orders are Sell and Buy Stops and the Stop Losses .
- Positions book. This histogram shows the distribution of traders' positions and prices they are open at.
The above information is available for 16 instruments: AUDJPY, AUDUSD, EURAUD, EURCHF, EURGBP, EURJPY, EURUSD, GBPCHF, GBPJPY, GBPUSD, NZDUSD, USDCAD, USDCHF, USDJPY, XAUUSD, XAGUSD.
Minimal data interval is 20 minutes, but for old history it can increase up to 1 day, there can also be unforeseen gaps.
For both histograms (orders and positions) There are four display formats
- base; base histogram is displayed without processing
- cumulative; each level shows the sum of the value for this level and all previous levels
- simple difference; instead of long and short orders (positions) their difference is displayed
- cumulative difference; difference for the cumulative histogram
The data is downloaded and stored using UTC time, so to display a histogram correctly need to specify correct time shift in the properties of the indicator -- your broker server time shift relative to UTC
indicator Settings
- Use Custom Instrument - True, if you have a nonstandard instrument name or you want to display a histogram on another instrument chart;
- Custom Instrument Name - name of the instrument in the format of Oanda FXLabs . For EURUSD - EUR_USD, for Gold, XAUUSD - XAU_USD, for Silver, XAGUSD - XAG_USD;
- Server UTC Time Offset - shift of your server time relative to UTC
- Show Histogram Cumulative - if True, shows cumulative histogram;
- Show Histogram Difference - if True, shows difference histogram. It works also for the cumulative mode.
- Show Orders (Positions if False) - if True, shows orders histogram, if False, shows positions histogram.
You can download it here: https://www.mql5.com/ru/code/15993


 Trading Guide")

