
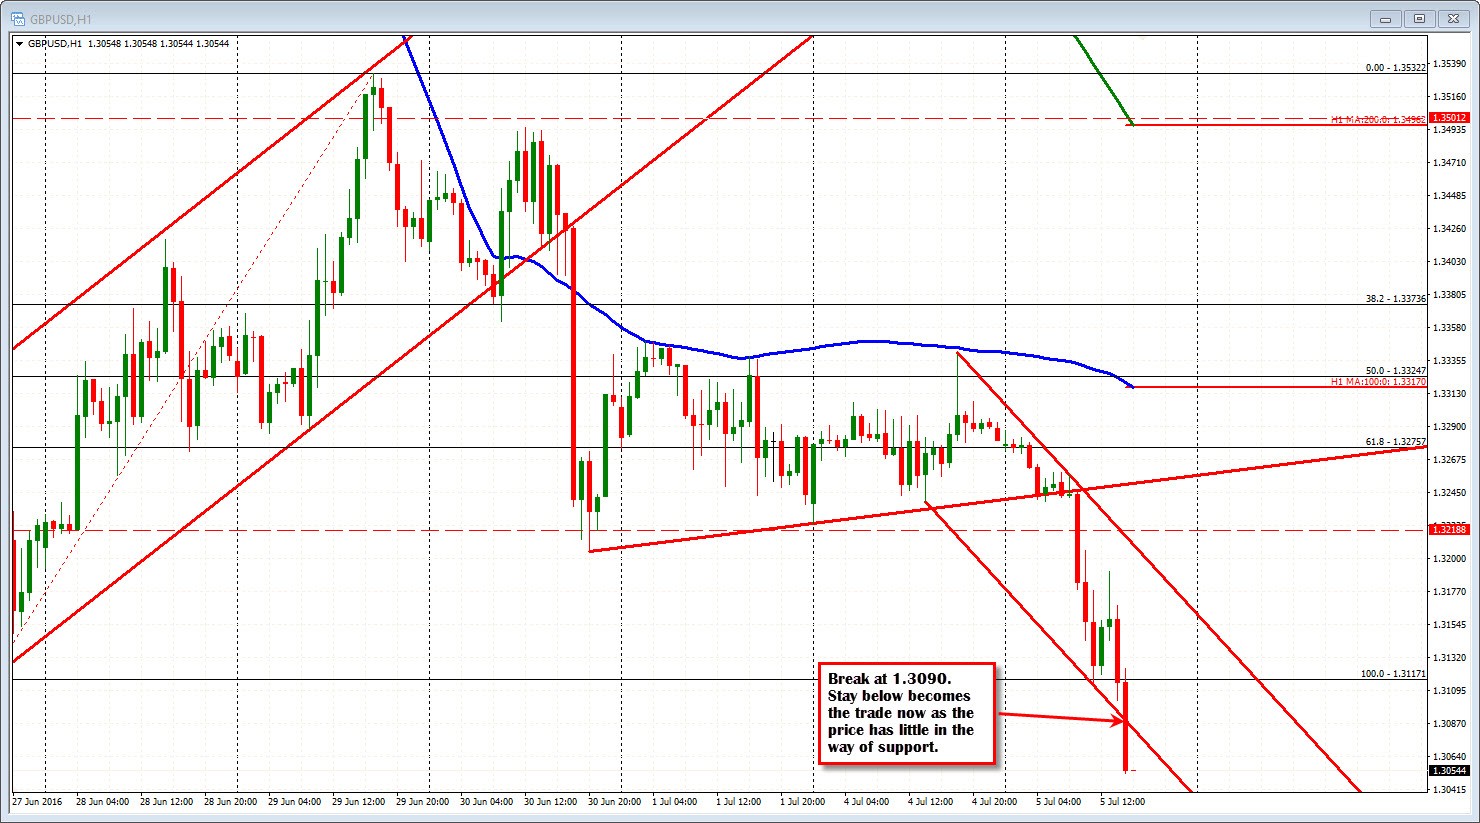
Takes out lower trend line on hourly chart. Timber
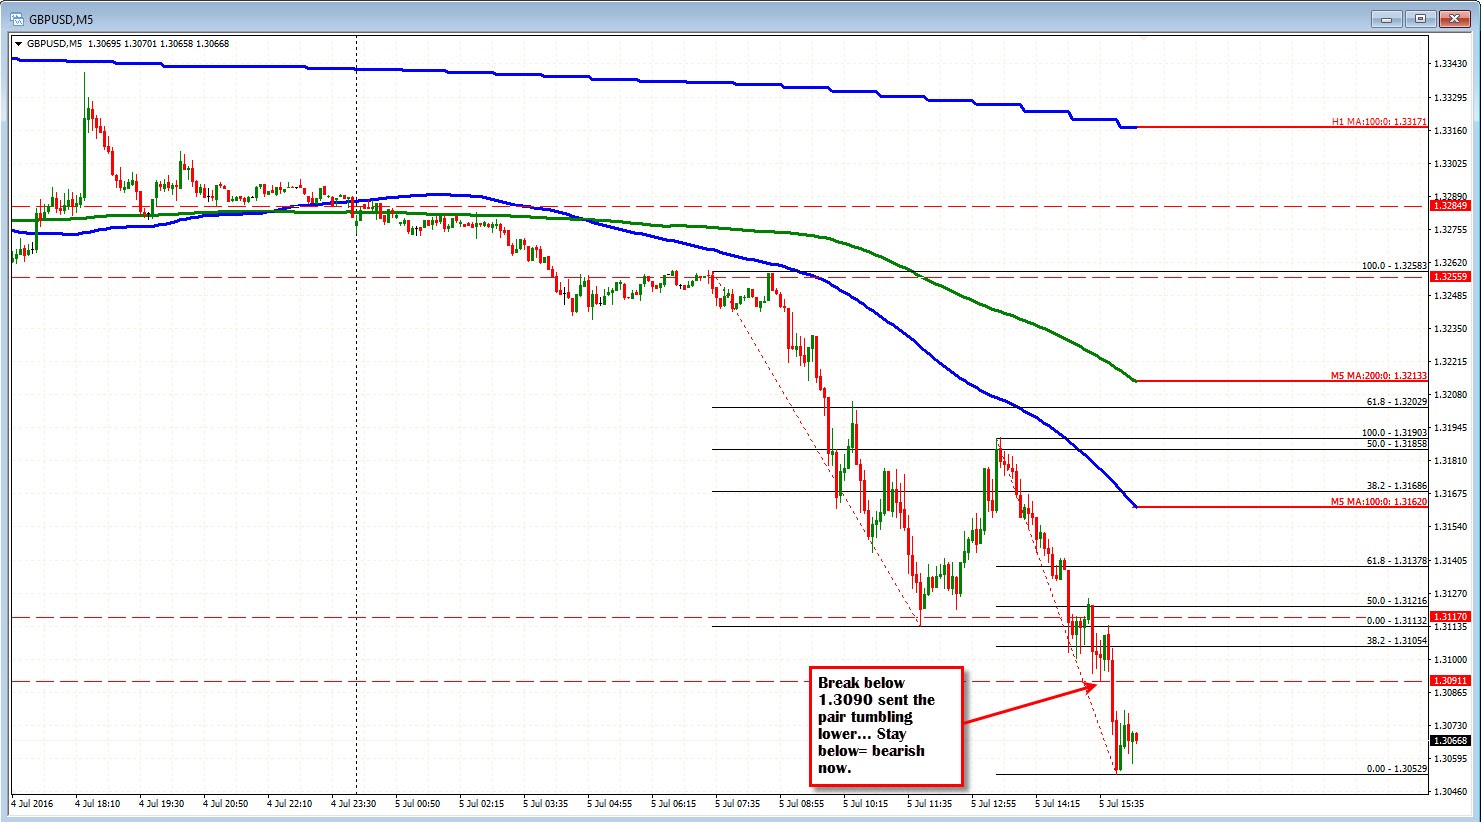
The GBPUSD just took out the lower trend line which held briefly at 1.3090 area, and we are seeing further selling as traders throw in the towel. With the price trading at lowest levels since 1985, there is not a whole lot to hang onto.
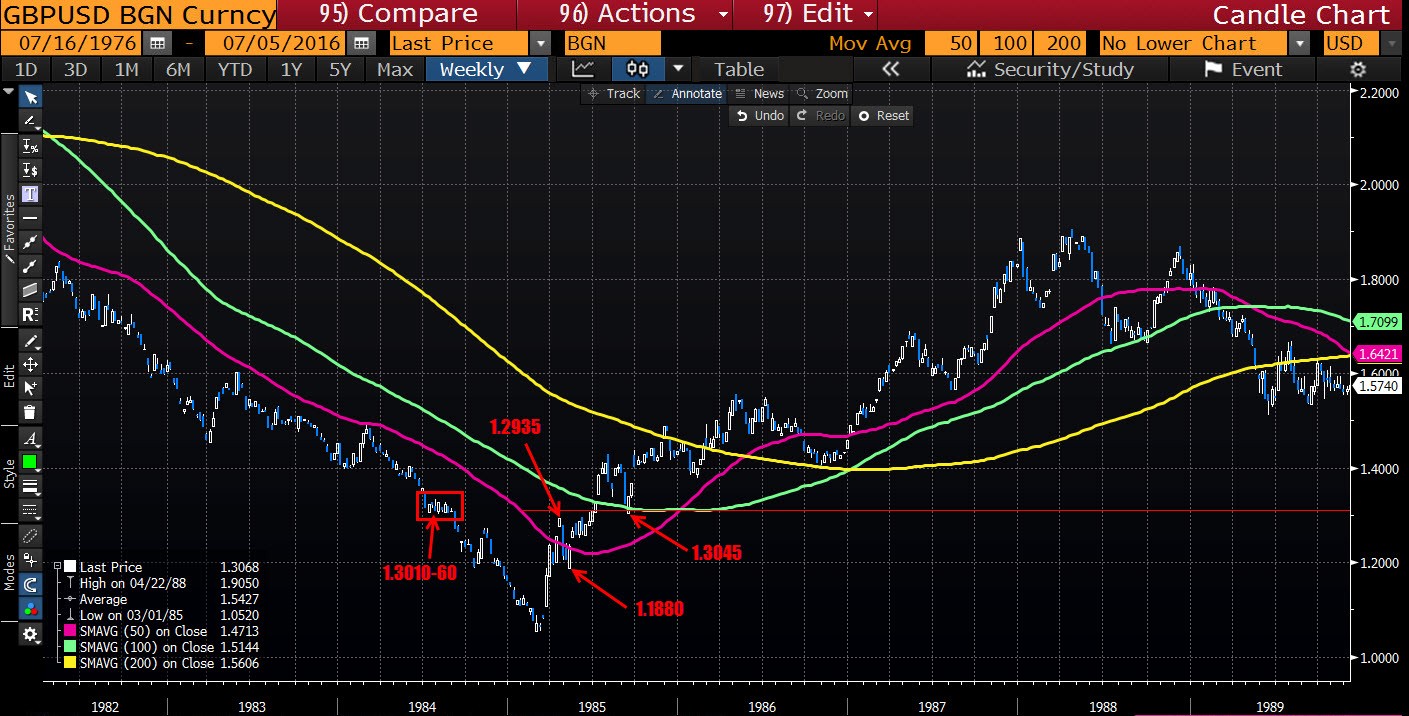
The pair is trading at levels not seen since 1985. The low from the week of Sept 13, 1985 was 1.3045. That was a swing low and not revisited again until - well maybe today. The low is 1.3053.
The
chart below outlines the swing lows/highs off a weekly chart going back
to the 1980s. The last swing low at 1.3045. Then there was a swing high
at 1.2935 (week of April 19, 1985). Going back to July to September
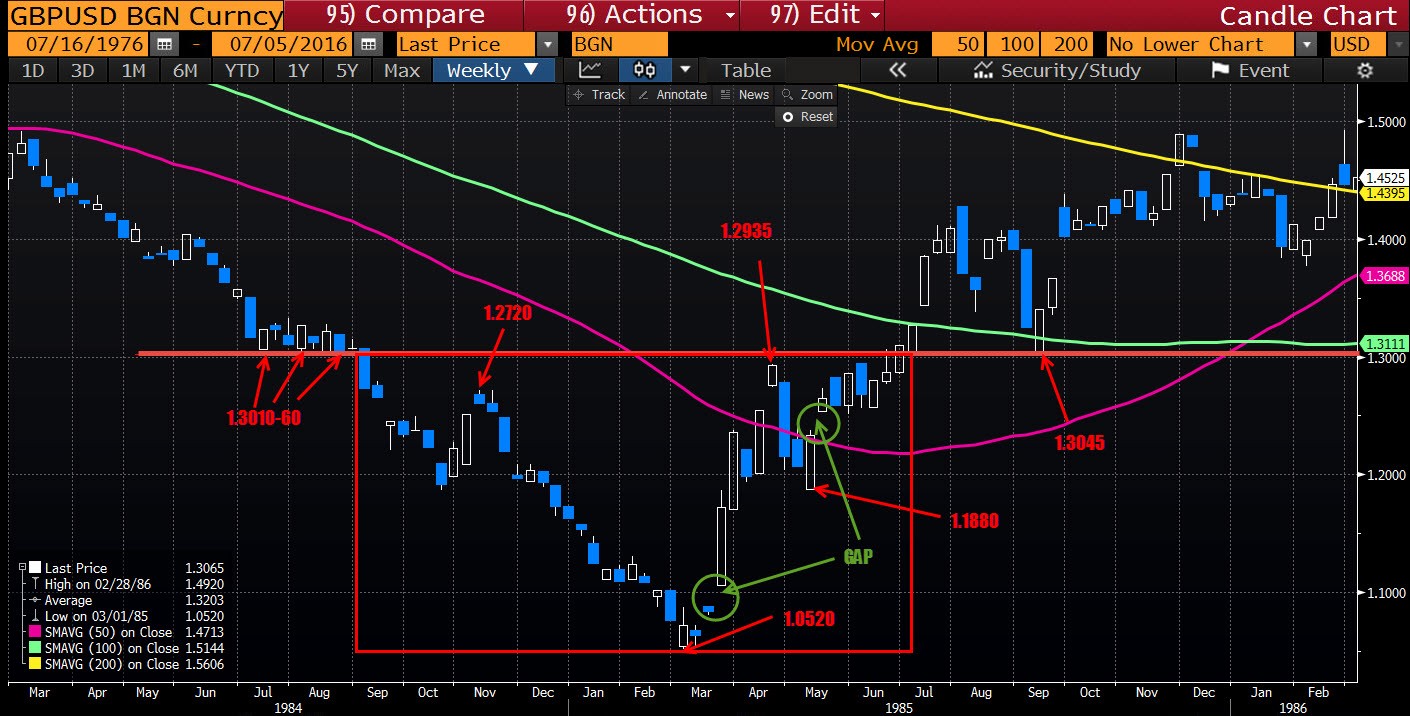
1984, the lows came in at 1.3010-1.3050 before breaking below the all
important 1.3000 level. It stayed below that 1.3000 level until June
1985.
This is what that area looks like close up
So
for traders technically, the 1985 swing low at 1.3045 is the next
target. The 1.3090 area is the resistance (risk) for the shorts.


")
![[XAUUSD]: Weekly Liquidity Activation Points (timings), June 22-26, 2026](https://c.mql5.com/6/1013/splash-preview-771790.png "[XAUUSD]: Weekly Liquidity Activation Points (timings), June 22-26, 2026")
