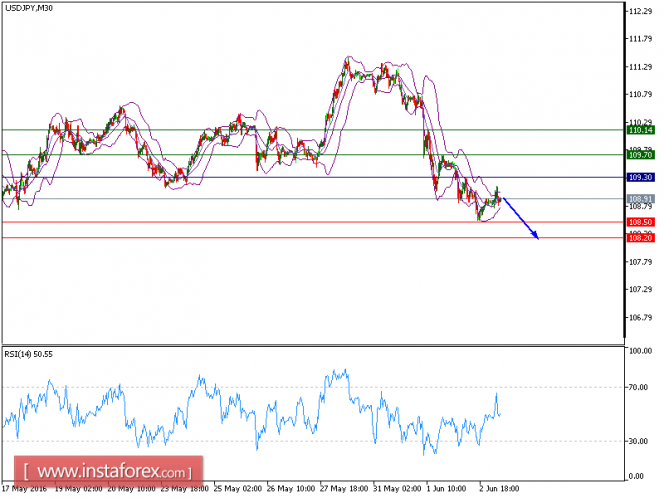
Technical Analysis of USD/JPY for June 03, 2016

USD/JPY is expected to trade in a bearish bias. Overnight, US stock indices recorded another stronger session while volumes remained muted. The Dow Jones Industrial Average rose 0.3% to 17838, the S&P 500 advanced 0.3% to 2105, and the Nasdaq Composite was up 0.4% to 4971. Healthcare, pharmaceutical and biotech shares were market leaders.
On the economic front, the ADP private payrolls in the US increased 173,000 in May (as expected, vs +166,000 in April). Meanwhile, all eyes are on May non-farm payrolls (vs +155,000 expected, +160,000 in April) and the jobless rate (expected to drop to 4.9% from 5.0%) to be reported Friday.
As expected, the European Central Bank left interest rates unchanged. President Mario Draghi stressed that further action will be taken if inflation remains below the target.
Nymex crude oil rebounded 0.3% to $49.17 a barrel, after it marked a day-low at $47.97 earlier in the session as OPEC members did not reach an output cap deal. Gold slid 0.2% to $1,210 an ounce, and the benchmark 10-year US treasury yield declined to 1.811% from 1.844% in the previous session.
In forex trading, the Japanese yen continued to strengthen against the US dollar following Prime Minister Shinzo Abe's plans to delay a sales tax hike and to unveil a fiscal plan. USD/JPY shed another 0.6% to 108.85 (day-low at 108.49), the lowest level in two weeks.
As the ECB provided no surprises, EUR/USD swung to a day-low of 1.1140 from a day-high of 1.1219 before ending the session 0.3% lower at 1.1149.
Meanwhile, the British pound showed signs of stabilization yesterday after plunging a combined 1.5% in the prior two sessions, with GBP/USD edging up 0.1% to 1.4422. The pair posted a rebound, which has brought it above the 20-period moving average (30-minute chart). Currently the pair is challenging the descending 50-period moving average. However, as long as the key resistance at 109.30 (a level of overlapping support and resistance) is not surpassed, the intraday outlook remains bearish, and the pair stands a high chance of retesting the first downside target at 108.50. Below that level the next support would be found at 108.20 (around the low of May 12).
Recommendations:
The pair is trading below its pivot point. It is likely to trade in a lower range as long as it remains below the pivot point. Short positions are recommended with the first target at 108.50. A break of this target will move the pair further downwards to 108.20. The pivot point stands at 109.30. In case the price moves in the opposite direction and bounces back from the support level, it will move above its pivot point. It is likely to move further to the upside. According to that scenario, long positions are recommended with the first target at 109.70 and the second one at 110.15.
Resistance levels: 109.70, 110.15, 110.40
Support levels: 108.50, 108.20, 107.75


