
ORB Analyzer – User Guide
Product: Click here
1. What This Indicator Does
ORB Analyzer is a statistical analysis tool for Opening Range behavior.
It evaluates what historically happened after a range breakout.
The indicator analyzes:
-
breakout continuation (TP vs SL hit rates)
-
trend persistence over time
-
mean reversion likelihood
-
behavior across different range sizes and times of day
It does not generate trade signals and does not predict the market, but it helps to identify dominant market behavior. Its purpose is to support data-driven decision-making.
2. Opening Range Concept
An Opening Range is the high–low price range formed during a user-defined time window.
The ORB Analyzer:
-
is not limited to market opens
-
works with any custom time window
-
evaluates price behavior relative to that range
All results are normalized using range multiples, making them comparable across volatility conditions. All calculations use M1 data, independent of chart timeframe.
Breakouts are evaluated using candle closes only.
Temporary intrabar moves and M1 price spikes that do not close outside the range are not counted as breakouts.
3. Range Size Context
Historical range sizes are divided into three relative categories:
-
Small (magenta)
-
Medium (orange)
-
Large (blue)
These categories provide statistical context:
-
small ranges often show higher breakout probability
-
medium ranges tend to mean revert more often
-
large ranges are more frequently trend-driven
4. Market Regimes Explained
The indicator classifies each day into one of three regimes:
For the Breakout model (see figure 1), the indicator:
-
waits for the first candle close outside the range
-
defines trade direction based on that breakout
-
applies Stop Loss and Take Profit levels as range multiples
A breakout is counted as successful if the Take Profit is reached before the Stop Loss.
If both levels are touched within the same candle, the outcome is treated conservatively as a failure.
Evaluation continues until the end of the trading day.

figure 1: typical breakout scenario
The Trend regime (see figure 2) measures directional persistence, not profit targets.
A day is classified as a successful trend day if:
-
price breaks out on only one side of the range
-
price does not break the opposite side
-
at or after the defined TrendEndHour , the last observed close remains outside the range in the breakout direction
This separates temporary expansion from sustained directional movement.
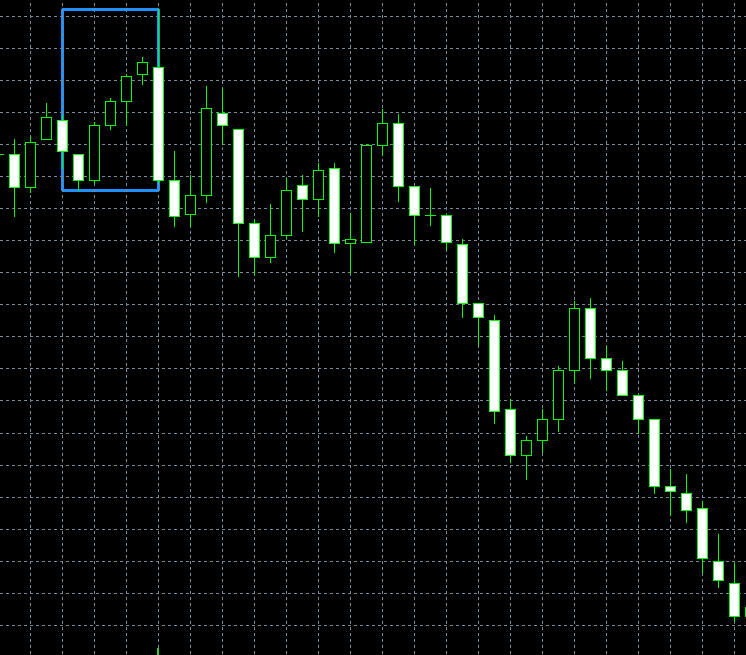
figure 2: typical trend scenario
Mean reversion (see figure 3) is evaluated in two steps:
-
Regime classification
A day is classified as mean-reverting if price closes beyond both sides of the range after the range window ends. -
Mean Reversion trade simulation
-
the first breakout direction is identified
-
entry occurs once price returns back into the range
-
Stop Loss and Take Profit are applied as range multiples
-
success is recorded if TP is reached before SL
-
As with the breakout model, simultaneous TP and SL hits are treated conservatively.

figure 3: typical mean reversion scenario
Difference between Breakout and Trend:
Breakout measures whether the move reached a predefined target before a predefined stop.
Trend measures whether the market stayed directional until a specific time.
5. Lookback period & Market Context
For each analyzed trading day, the indicator:
-
Identifies the defined range using the specified start time and duration
-
Stores the range high, range low, and total range size
-
Repeats this process until the requested number of past trading days is collected
A maximum calendar lookback limit is applied to account for holidays and non-trading days.
To reflect changing market conditions, the indicator is designed to prioritize recent data.
While longer lookback periods can provide a broader historical overview, excessively long samples may mix incompatible market regimes.
For practical analysis, a lookback of up to approximately 30- 100 trading days is recommended, with longer periods used mainly for general context.
6. Inputs
This section explains all input parameters of the indicator and how they affect the analysis.
All times are based on the broker’s server time.

figure 4: input variables
General
Chart Symbol
If left empty, the indicator uses the symbol of the current chart.
Number of Past Trading Days
Defines how many historical trading days are analyzed for the statistics and hit rate calculations.
Higher values increase statistical stability but may include outdated market conditions.
Maximum Calendar Days Back (Buffer)
Sets the maximum number of calendar days the indicator is allowed to look back to collect the requested number of trading days.
Useful for periods with holidays or low liquidity.
Opening Range
OR Start Hour (Broker Server Time)
Hour at which the Opening Range calculation starts, based on the broker’s server time.
OR Start Minute
Minute at which the Opening Range calculation starts.
OR Duration (Minutes)
Length of the Opening Range in minutes.
The high and low during this period define the Opening Range.
Breakout Model
Stop Loss (OR Multiplier)
Stop Loss distance expressed as a multiple of the Opening Range size.
Example: 1.0 = Stop Loss equals the full Opening Range.
Take Profit (OR Multiplier)
Take Profit distance expressed as a multiple of the Opening Range size.
Mean Reversion Model
Stop Loss (OR Multiplier)
Stop Loss distance expressed as a multiple of the Opening Range size for mean reversion trades.
Take Profit (OR Multiplier)
Take Profit distance expressed as a multiple of the Opening Range size.
Evaluation Times
Trend Evaluation Time (Hour)
Hour at which breakout (trend-following) performance is evaluated.
Mean Reversion Evaluation Time (Hour)
Hour at which mean reversion performance is evaluated.
Panel
Panel Position (0=LT, 1=RT, 2=LB, 3=RB)
Defines the corner of the chart where the panel is displayed
(LT = Left Top, RT = Right Top, LB = Left Bottom, RB = Right Bottom).
Horizontal Offset (Pixels)
Moves the panel horizontally from the selected corner.
Vertical Offset (Pixels)
Moves the panel vertically from the selected corner.
Panel Update Interval (Seconds)
Defines how often the panel data is refreshed.
7. Disclaimer
All results are based on historical data and do not account for slippage, spreads, commissions, or execution constraints.
Past behavior does not guarantee future outcomes.


