EUR/USD: Dollar Gains on Strong Retail Sales
EUR/USD Current Price: 1.1312

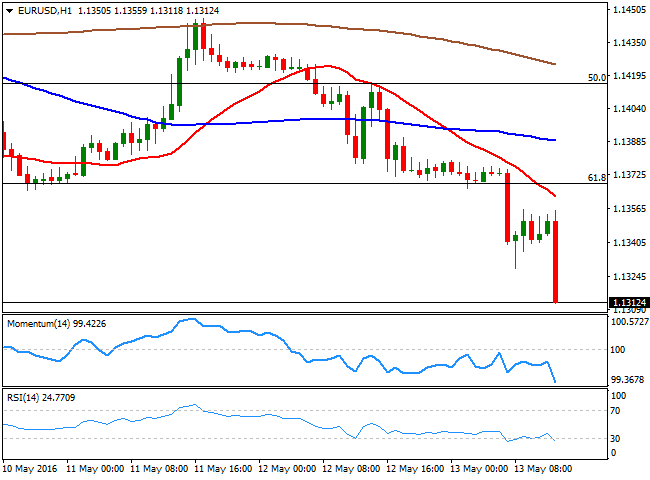
The common currency started the day with a sour tone, on mixed data coming from Europe. The EUR/USD pair fell down to 1.1328, its lowest for the week, as inflation came in negative, although in line with expectations in Germany, indicating the deflationary pressure is still strong in the region. GDP data in Germany, surprised to the upside, with the country growing 0.7% in the first quarter according to official data. European GDP however, resulted at 0.5%, below the 0.6% previous or expected. The market made then a pause ahead of the release of the US data, with Retail Sales for April surprising to the upside as it surged 1.3% compared to the previous month, pushing the annual reading higher to 0.8%. Producer Price index, came in at 0.9% compared to a year before, and up 0.1% monthly basis as expected.
The dollar rallied after the news, and the EUR/USD pair approaches the 1.1300 as of writing, with a strong downward momentum in the short term, and poised to extend its decline towards 1.1280 a major static support. In the 4 hours chart, the price is now well below its moving averages, whilst the technical indicators present sharp downward slopes near oversold levels, supporting a break below the mentioned support and an extension down to 1.1240.
Support levels: 1.1280 1.1240 1.1200
Resistance levels: 1.1340 1.1370 1.1410
GBP/USD Current price: 1.4376

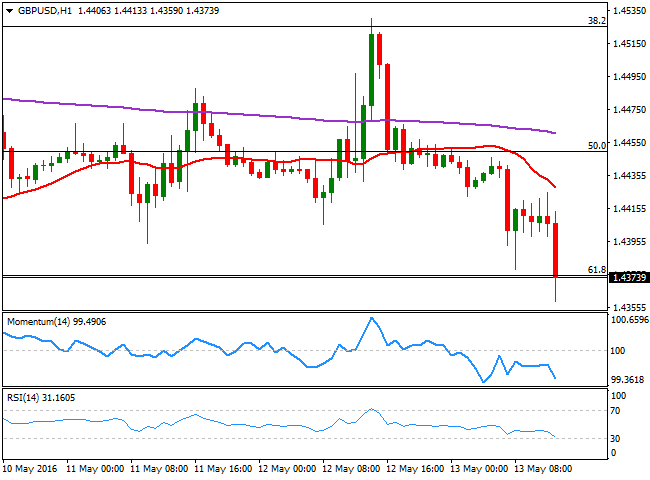
The GBP/USD traded lower within range this Friday, approaching the weekly low, as it printed 1.4378 early Europe, and consolidating around the 1.4400 figure ahead of the release of the US data, which triggered a downward move towards 1.4359. Nevertheless the pair initially bounced back towards the 1.4370/80 region, where it stands ahead of the US opening. The technical outlook however, favors the downside as in the 1 hour chart, the technical indicators have turned sharply lower within bearish territory, while the 20 SMA has accelerated its decline above the current level, now acting as a dynamic resistance around 1.4440. In the 4 hours chart, technical readings also favor a downward continuation, with the price extending below the 200 EMA, for the first time since mid April, and pointing for a continued decline down to 1.4250.
Support levels: 1.4330 1.4290 1.4250
Resistance levels: 1.4400 1.4440 1.4480
USD/JPY Current price: 109.29

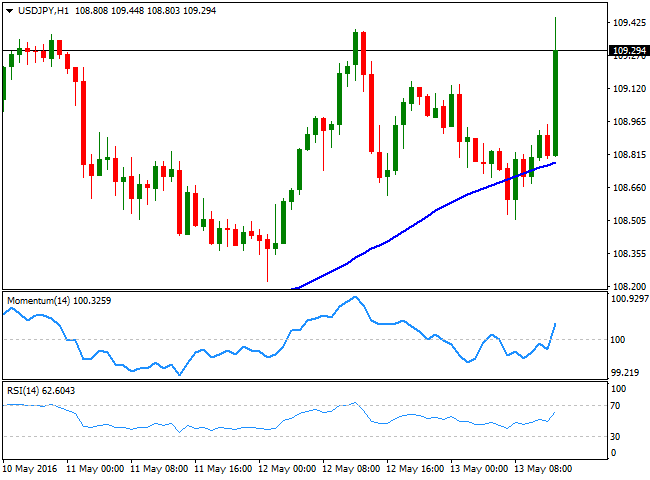
The USD/JPY pair spiked up to a fresh weekly high of 109.55, and remains near the highs, but contained, as better-than-expected US Retail Sales helped the pair rally, although not yet enough to confirm a bullish continuation. Technically, the 1 hour chart favors a continued advance, as the price has bounced from a bullish 20 SMA, whilst the technical indicators head sharply higher within bullish territory. In the 4 hour chart, however, the pair is still having trouble to overcome its 200 SMA, although the technical indicators maintain their strong bullish slopes, supporting a test of the 110.00 region, during the upcoming hours, particularly if US stocks recover ground after the opening.
Support levels: 109.00 108.60 108.20
Resistance levels: 109.50 110.00 110.60


