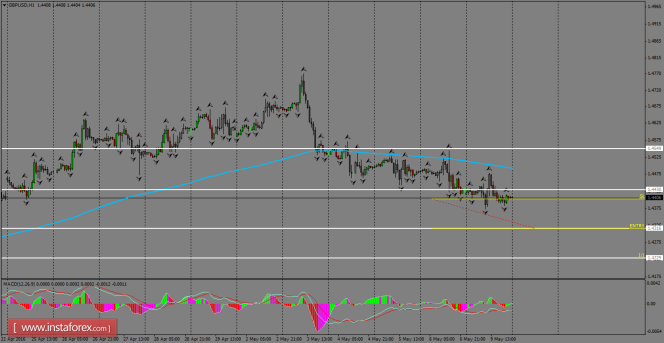
Daily Analysis of GBP/USD for May 10, 2016
On H1 chart, GBP/USD is doing a bearish consolidation below the resistance level of 1.4430, waiting for further declines towards the 1.4316 level. We're seeing that the 200 SMA in this time frame is still above the current price zone as it continues to strengthen the bearish bias in a short-term view. Yesterday's lows should be broken in order to accelerate the decline.

H1 chart's resistance levels: 1.4430 / 1.4549
H1 chart's support levels: 1.4316 / 1.4229
Trading recommendations for today:
Based on the H1 chart, place sell (short) orders only if the GBP/USD pair breaks a bearish candlestick; the support level is at 1.4316, take profit is at 1.4229 and stop loss is at 1.4402.
The material has been provided by 


