S&P500: Short-Term Correction is Possible
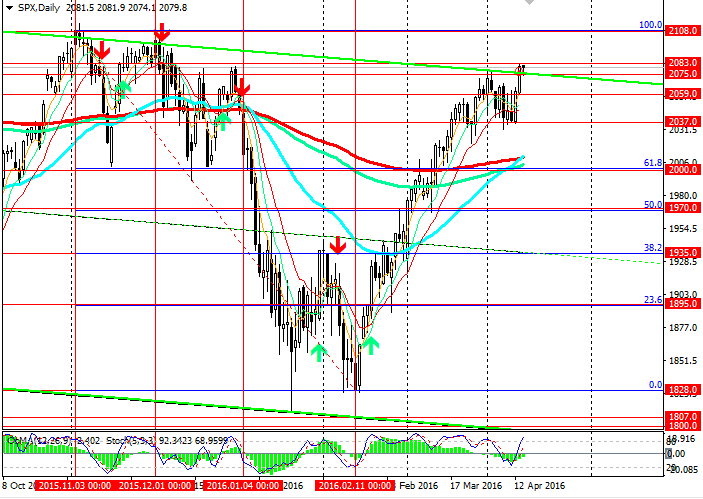
This week, the index S&P500 has again reached annual highs, regaining the losses incurred since the beginning of this year. The index has almost approached the highs of December 2015 at the level of 2108.0 (Only 250 points are left before reaching this level).
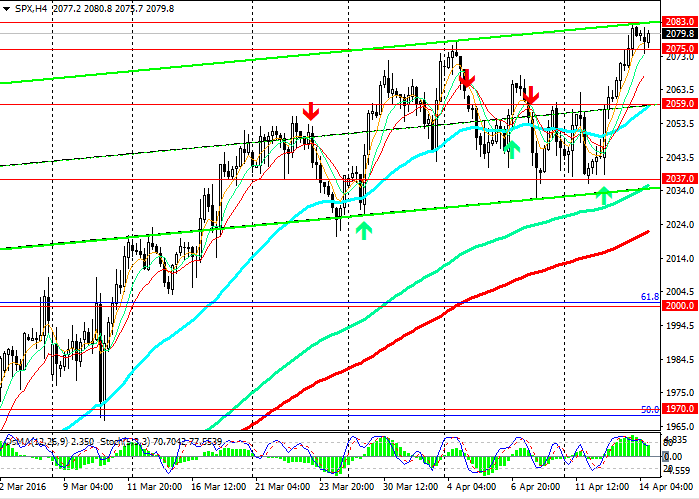
The price is above the strong support level of 2000.0 (Fibonacci 61.8% to the decline since December 2015, ЕМА200, ЕМА144 on the daily chart). Therefore, positive dynamics continues. On the daily and weekly charts the indicators OsMA and Stochastic give buy signals. However on 4-hour chart the indicators OsMA and Stochastic are reversing towards the short positions. It is possible that the index will undergo short-term correction to the levels of 2075.0 and 2059.0 (ЕМА50 and middle of the ascending channel on 4-hour chart).
Breakout of the resistance level of 2083.0 (recent highs) will trigger further rise in the index S&P500.
Support levels: 2075.0, 2059.0, 2045.0, 2037.0, 2025.0 and 2000.0.Resistance levels: 2083.0, 2100.0 and 2108.0.
Trading tips
Sell Stop: 2070.0. Stop-Loss: 2083.0. Targets: 2059.0 and 2037.0.
Buy Stop: 2085.0. Stop-Loss: 2075.0. Targets: 2100.0 and 2108.0.


The material has been provided by LiteForex - Finance Services Company - www.liteforex.com


