USD/CHF: Near the Level of 0.9565
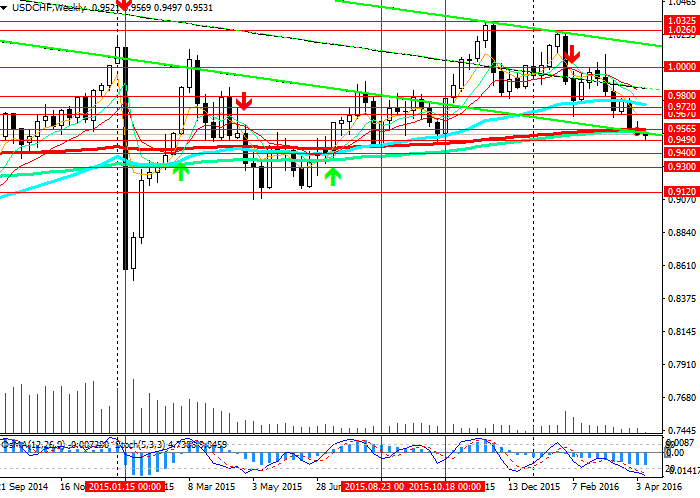
Last week, the pair USD/CHF has broken out strong resistance level of 0.9565, which is crossed by moving average lines ЕМА200, ЕМА144 and bottom limit of the descending channel on the weekly chart. The lower the price goes below this level, the stronger will be pressure on the CHF.
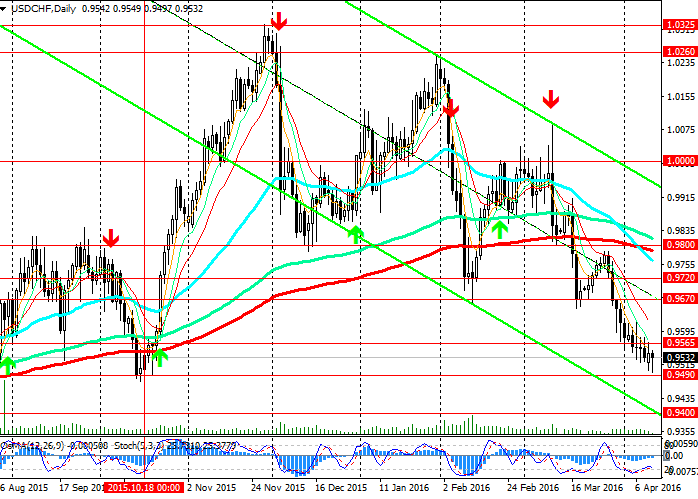
On the daily chart the indicators OsMA and Stochastic show probability of the reversal movement in the pair. The bars of OsMA histogram are rising, approaching the zero line. Stochastic is leaving oversold zone.
Current fundamental background shows that further decline in the USD is unlikely. In the medium-term it is preferable to open long positions on the pair USD/CHF.
Meanwhile, it is too early to open long positions. Long positions can be opened after the rise in the pair USD/CHF above the levels of 0.9670 (ЕМА144) and 0.9720 (ЕМА200 on 4-hour chart).
After consolidation of the price above the level of 0.9565 it is possible to open short-term long positions.
Breakout below support level of 0.9490 may trigger further decline in the pair to 0.9400 (lower limit of the descending channel on the daily chart) and 0.9300 (lows of August 2015).
Do not forget that SNB may interfere trades if CHF strengths too much.
Support levels: 0.9500, 0.9490 and 0.9400.
Resistance levels: 0.9565, 0.9600, 0.9670, 0.9720 and 0.9800.
Trading tips
Buy Stop: 0.9590. Stop-Loss: 0.9550. Targets: 0.9670, 0.9720, 0.9800, 0.9860, 0.9900 and 1.0000.
Sell Stop: 0.9490. Stop-Loss: 0.9530. Targets: 0.9400 and 0.9300.


