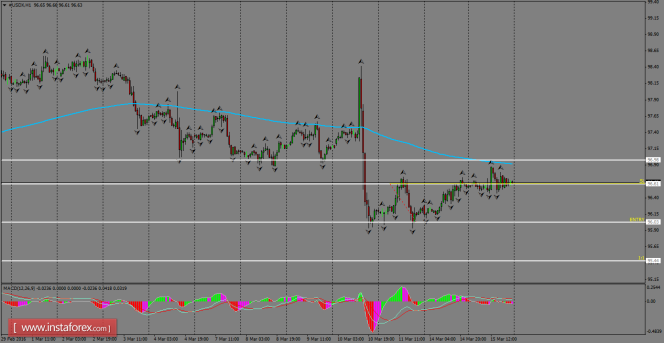
Daily analysis of USDX for March 16, 2016
USDX is extending the corrective bullish move towards the 200 SMA zone at the H1 chart, which is very close to the resistance level of 96.98. A pullback can happen to reach new lows, but before that, we need to see first a breakout of the support level of 96.03. Currently, the bias is showing a slow tone on the Index.

H1 chart's resistance levels: 96.61 / 96.98
H1 chart's support levels: 96.03 / 95.44
Trading recommendations for today: Based on the H1 chart, place sell (short) orders only if the USD Index breaks with a bearish candlestick; the support level is at 96.03, take profit is at 95.44, and stop loss is at 96.61.
The material has been provided by InstaForex Company - www.instaforex.com


