Gold Analysis for March 09, 2016
Overview :
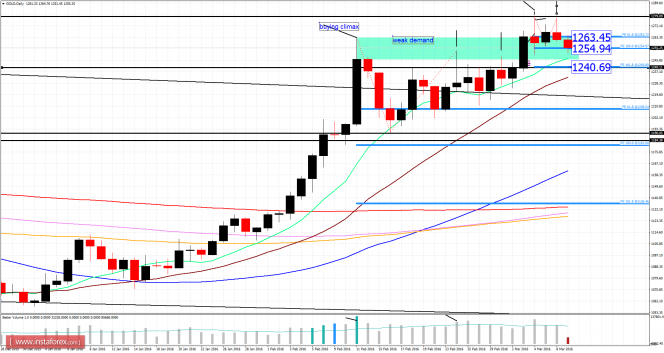
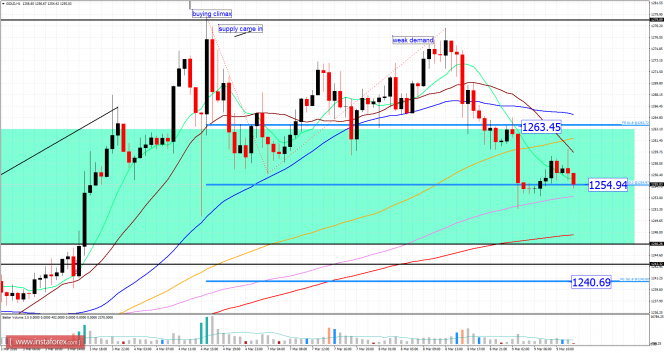
Since our last analysis, gold has been trading downwards. As I expected, the price tested the level of $1,251.45 in a high volume. In the daily time frame, I found a supply bar (upthrust), which is the sign of weakness and sluggish demand. Intraday buying looks risky at this stage. According to the H4 time frame, the price has reached my second take-profit level of $1,254.00. We may see potential testing of the third intraday target at the level of $1,240.70.


Daily Fibonacci pivot points:
Resistance levels:
R1: 1,272.90
R2: 1,276.00
R3: 1,282.40
Support levels:
S1: 1,261.20
S2: 1,257.00
S3: 1,251.80
Trading recommendations for today: be careful when buying gold at this stage and watch for potential intraday selling opportunities.
The material has been provided by InstaForex Company - www.instaforex.com


