GoldTtechnical Analysis for March 8, 2016
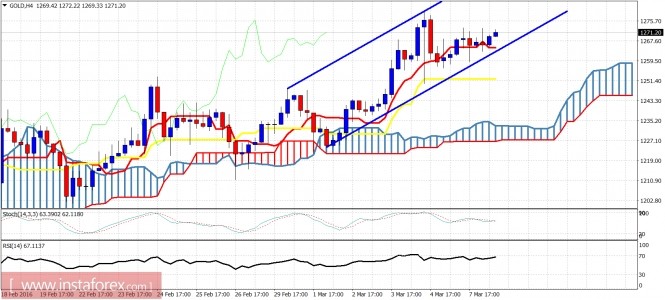
Gold remains supported inside the bullish channel boundaries and this implies that at least one more new higher high should be hit. The target area remains around $1,300-$1,320, but this does not mean that we could see a top at lower levels. We are now at the final stage of a rise from $1,045.

Blue lines - bullish channel
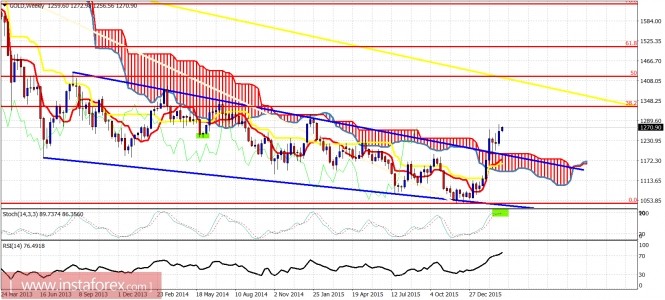
Gold price found support at $1,260-50 in the short-term and at $1,225 in the medium-term. Long-term support at a low of $1,045 last year. Gold is moving higher in an impulsive pattern. A new high is expected over the coming days.

Blue lines - downward sloping wedge
Yellow line - long-term resistance
The price remains well above the downward sloping wedge and the Kumo (cloud) support that was resistance. The price continues to move higher in a bullish short-term trend. However, the entire formation tells me that this upward reversal is a longer-term bullish reversal and that after the upcoming pullback towards $1,200-$1,100 we should be buyers again.
The material has been provided by InstaForex Company - www.instaforex.com


