
GBP/USD Intra-Day Technical Analysis - ranging bearish for waiting to break the levels

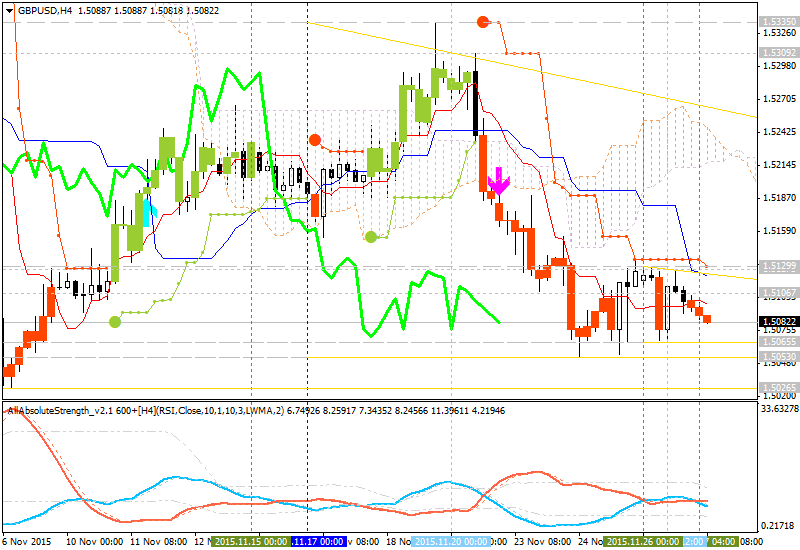
H4 price is on bearish market condition located below Ichimoku cloud and Sinkou Span line which is the virtual border between the primary bullish and the primary bearish on the chart. The price is on secondary ranging within the following support/resistance levels:
- 1.5129 resistance level located near and below Ichimoku cloud on the border between the primary bearish and the primary bullish on the chart, and
- 1.5026 support level located far below Ichimoku cloud in the primary bearish area of the chart.
Absolute Strength indicator's data is estimating the ranging market condition, and Chinkou Span line is located below the price and indicating the bearish trend to be continuing by direction.
- The nearest support levels for intra-day price are 1.5053 and 1.5026.
- The nearest resistance levels for the price are 1.5129 and 1.5309.
| Resistance | Support |
|---|---|
| 1.5129 | 1.5053 |
| 1.5309 | 1.5026 |
If
H4 price will break 1.5026 support level on close H4 bar so the primary bearish market condition will be continuing.
If H4 price will break 1.5129 resistance level so the reversal to the primary bullish
condition with secondary ranging may be started.
If not so the price will be on ranging within the levels.
- Recommendation for long: watch close H4 price to break 1.5129 for possible buy trade
- Recommendation
to go short: watch H4 price to break 1.5026 support level for possible sell trade
- Trading Summary: ranging
SUMMARY : bearish


")