
Quick Technical Overview - NIKKEI 225 Index: bullish on reversal
16 November 2015, 06:11

0
656
Weekly price is on bullish market condition located near and above Ichimoku cloud between the following key reversal support/resistance levels:
- 20975 resistance level located far above Ichimoku cloud in the bullish area of the chart; if the price breaks this level so we may see good bullish breakout; and
- 16985 support level located below Ichimoku
cloud in the bearish area of the chart; if the price breaks this level
so the bearish breakdown may be started.
Chinkou Span line is located to be below and near the price for possible breakout in the near future. Absolute Strength indicator is estimating the bullish trend to be continuing.
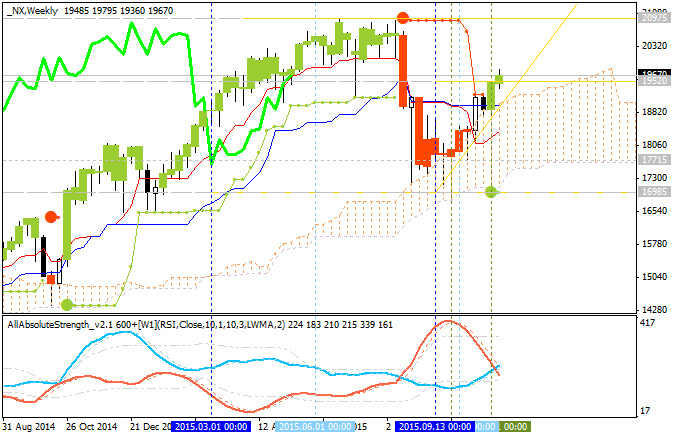
- watch close price to break 20975 resistance level for possible buy trade;
- watch price to break 16985 support level for possible sell trade.


")