

Global brokerage BTIG suggests that the dollar is approaching a 12-year high.
This is because ICE Dollar index broke a triangle formation last week, which occurs on a candlestick chart when intraday price peak declines and lows rise, creating shrinking price ranges that preface a rally or selloff. Bloomberg explains that the triangle is a chart formation used in technical analysis, or the study of historical trading patterns to predict changes in an asset such as a commodity or currency.
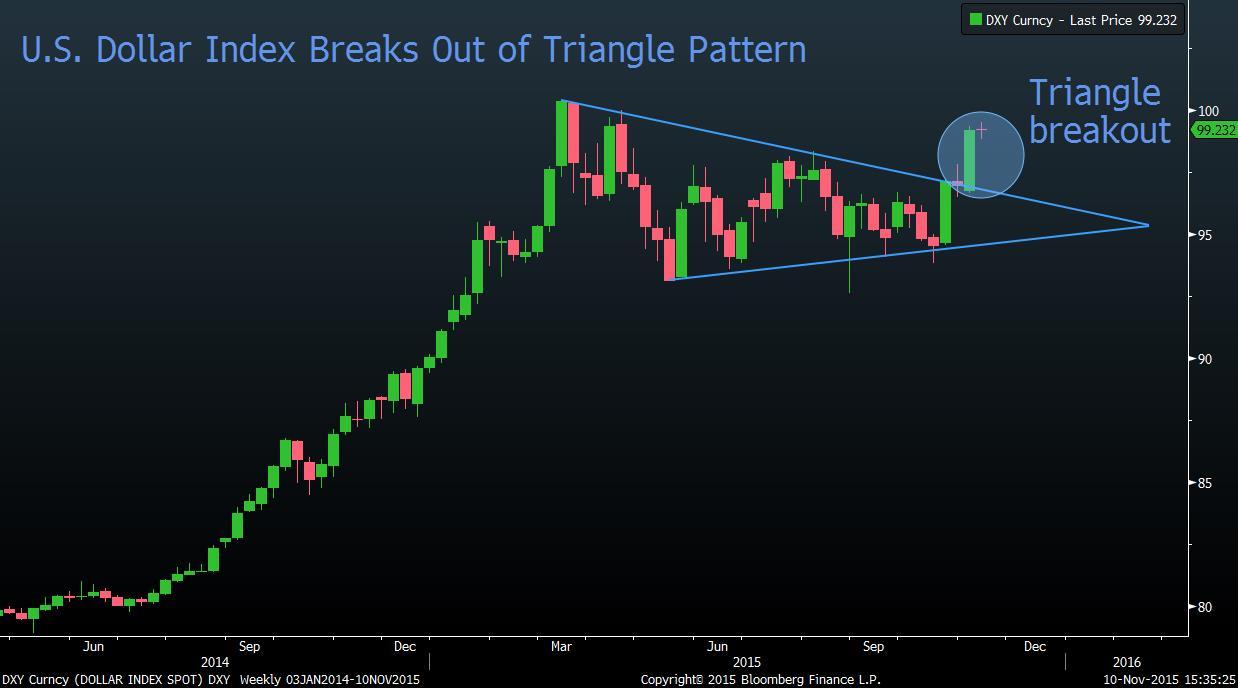
"The breakouts from these patterns,
whether to the upside or downside, tend to be pretty explosive, and
already we’re getting a glimpse of that," said Katie Stockton, the company’s
chief market strategist in New York. Stockton compared the recent price action to a coiled-up spring that’s been
released, setting up further advance of almost 3 percent.
The rally began after a U.S. jobs report released on November 6 beat forecasts, boosting speculation that the Federal Reserve will increase interest rates at its December meeting.
BTIG also says that the rally in the U.S. Dollar Index may extend to 102, a level last touched in 2003.


")

")