

Dana Lyons, a partner at J. Lyons Fund Management, has noticed in his blog post that a rally has been shrinking for tech stocks. The Nasdaq-100 is up 6.53% since the trough in September, but the broader Nasdaq market signals more daily losers than winners over the past month.
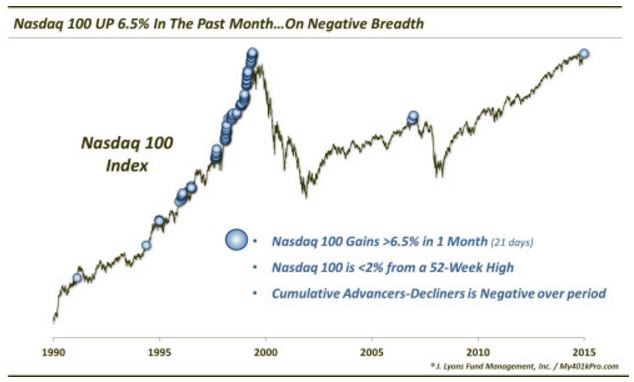
The chart above shows all times since 1990 when:
- The NDX gained at least 6.5% over a 1-month span (i.e., 21 days)
- The NDX closed within 2% of its 52-week high
- The cumulative daily difference between Nasdaq advancing issues and declining issues was negative during that period (i.e., there were more daily decliners than advancers during the month)
“That is quite an internal contrast in the market. And it is
extremely unusual for an NDX that is very near its 52-week highs — at
least over the past 15 years,” writes Lyons in his blog post.
On
the one hand, this market has managed over recent months and years to
push its way higher past every piece of structural worry that
has crossed its path, he says.
But on the other, he’s seeing structural softness and divergences for stocks that haven’t been seen since 2000 and 2007, when the market was unable to get past those internal challenges.
Lyons cautions that “it is our contention that the market remains with the confines of its post-2000 secular bear market. Thus, we would favor the latter camp. That is, we do not believe the Nasdaq-100, or the other leaders in the market will be able to carry the ever-increasing burden indefinitely.”
There is no threat of an unavoidable collapse right now, but the more support that comes away, “the more vulnerable this house of cards will be,” he writes.


")