
Technical Price Action Analysis - Dollar Index: on the border between bullish ranging and the secondary correction
16 October 2015, 15:11

0
1 088
W1 price is above 200 period SMA and above 100 period SMA for the primary bullish market condition. Price is ranging between the following key support/resistance levels:
- 92.62 key support level located above 100-SMA/200-SMA on the border between bullish ranging and the secondary correction, and
- 100.39 key resistance level located far above 100-SMA/200-SMA on the bullish area of the chart.
100-SMA is above 200-SMA estimating the bullish trend to be continuing by the direction.
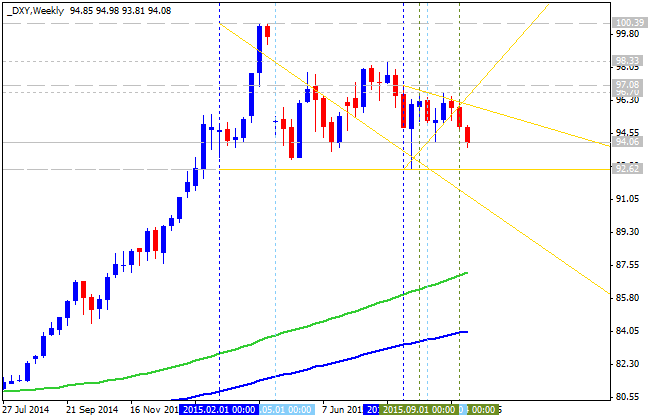
If the price will break support level at 92.62 so the secondary correction will be started.
If the price will break resistance level at 100.39
from below to above so the bullish trend will be continuing.
If not so the price will be ranging between within the levels.
| Resistance | Support |
|---|---|
| 98.33 | 92.62 |
| 100.39 | N/A |
Trend:


 Trading Guide")
