
Ominous "death cross" technical pattern can signal rallies - Bloomberg strategist

The "death cross" omen in the Standard & Poor's 500 gauge may well predict better days if history is any guide, says Bloomberg strategist.
Sejul Gokal explains that the uncommon chart pattern is
formed when the 50-day moving average crosses below the 200-day moving
average and is considered bearish by most technical analysts.
However, the last two times the signal emerged, in 2010 and 2011, it preceded sizable rallies in U.S. stocks.
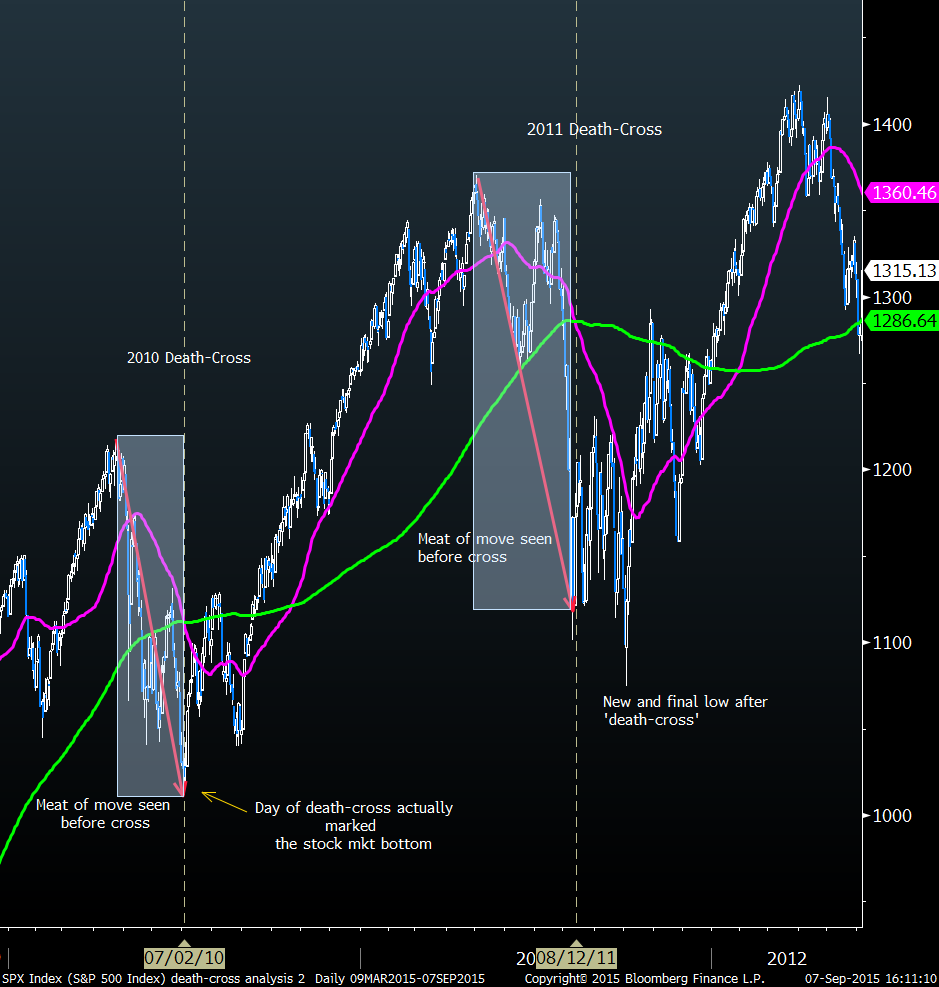
August 28 marked the formation of the most recent death cross, when U.S. equities followed a global turmoil started in China.
The S&P 500 touched a 10-month intraday trough on Aug. 24, though has since regained 5.5 percent.
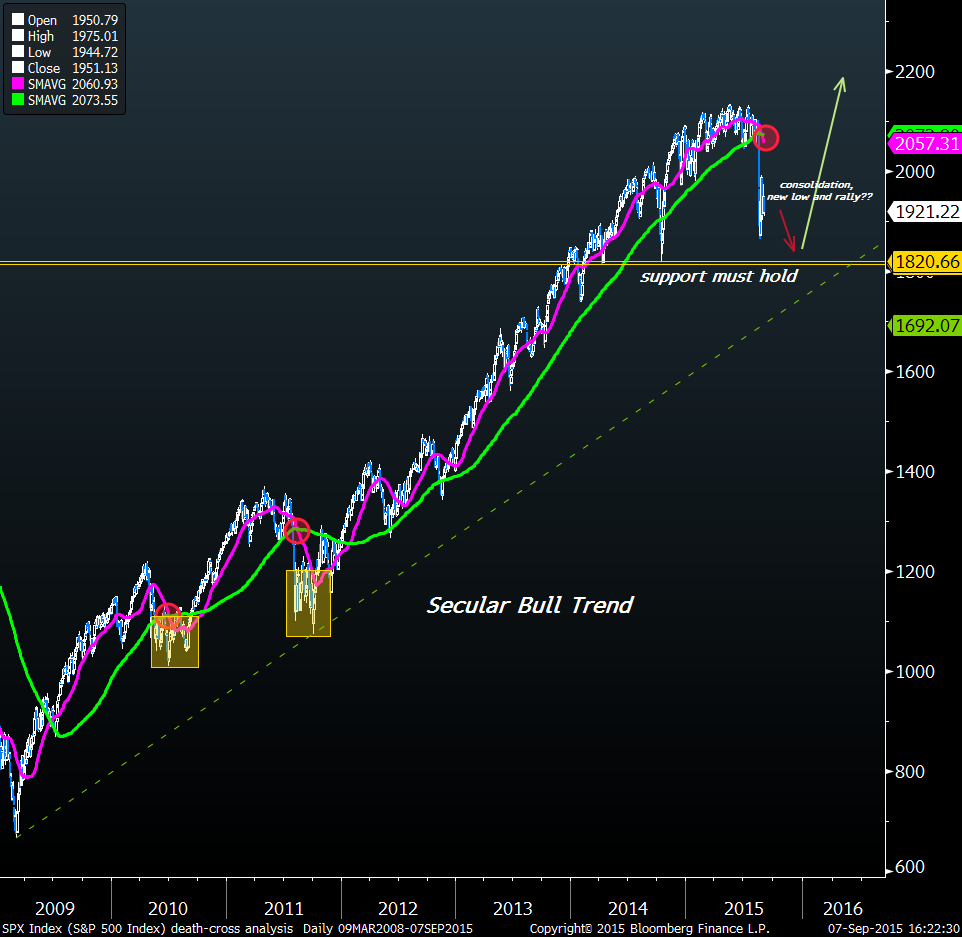
If 2011 patterns repeat themselves, the gauge may consolidate further in September,
possibly making one fresh and final low, while still holding above
key support zone around the 1,821/1,814 level, before restoring its
secular bull trend.
Gokal also notes that the S&P 500’s daily Moving-Average Convergence-Divergence, another technical signal known as the MACD, is close to levels that anticipated the stock-market bottom in 2011 and the multi-year rally that followed.
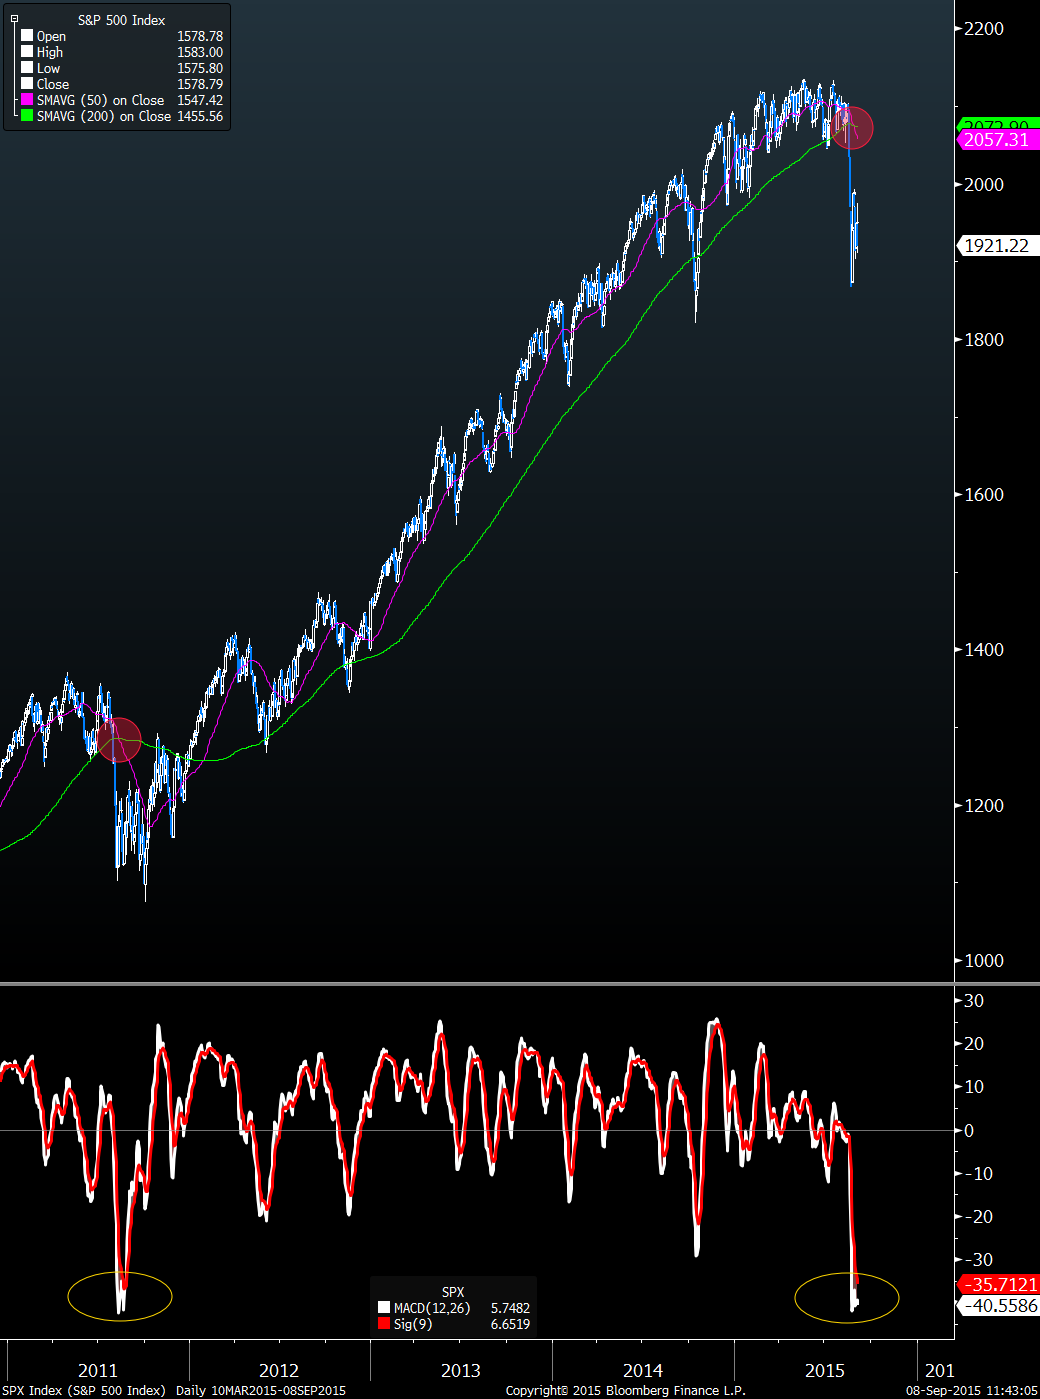
Gokal also reminds that investors should keep in minds that earlier this year, the monthly MACD crossed down from elevated levels.
That cross has been maintained, triggering a downside risk hanging over the S&P 500. A weekly close below the 1,814 level would potentially indicated a deeper correction toward 1,737/1,711.


