

0
1 456
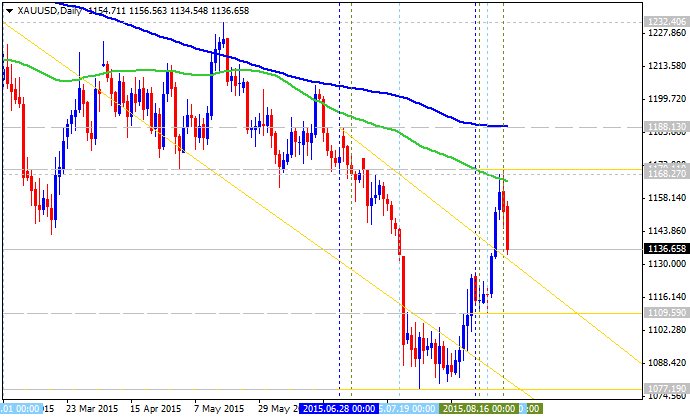
D1 price is on primary bearish market condition located below 200 day SMA (200-SMA) and below 100 day SMA (100-SMA):
- the price is located near and below 100-SMA at 1170.11 resistance;
- the price is located below 200-SMA at 1188.13 resistance; if the price crosses 200-SMA from below to above so we will see the reversal of the price movement from the primary bearish to the bullish market condition.
Few descending triangle patterns were formed by the price to be crossed to below for the bearish trend to be continuing.
- If the price breaks 200-SMA at 1188.13 resistance level so the price will be reversed from the primary bearish to the primary bullish trend on daily chart.
- If the price will break 1077.19 support level so the bearish market condition will be continuing.
Trend:
- D1 - ranging bearish
- W1 - ranging bearish
- MN1 - ranging bullish


 Trading Guide")

