
EUR/USD Intra-Day Technical Analysis - symmetric triangle pattern to be broken for direction
5 August 2015, 12:27

2
2 119
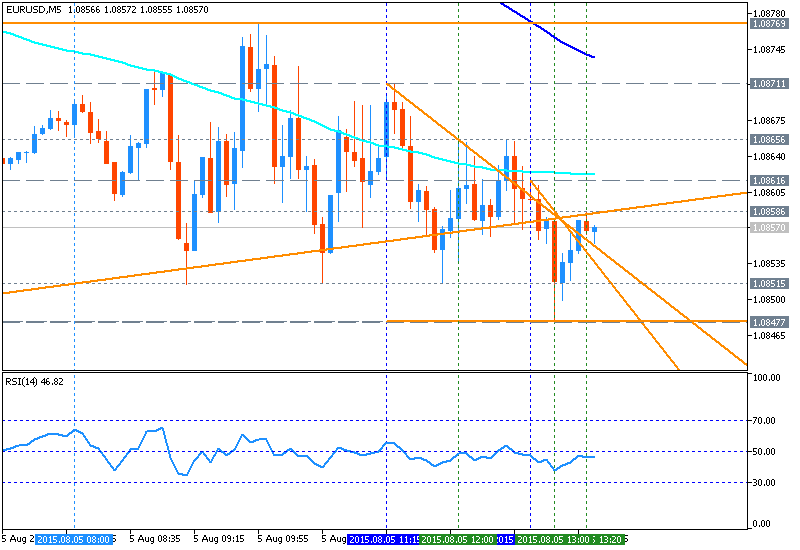
M5 price is located below SMA with period 200 (200-SMA) for the primary bearish market condition. SMA with the period 100 (100-SMA) is located near and above the price, and if the price will break 100-SMA from below to above so we may see the ranging market condition within the primary bearish. The price is breaking symmetric triangle pattern for direction ranging between the following levels:
- 1.0876 resistance located above 200-SMA on the bullish area of the chart, and
- 1.0847 support levels located on bearish area out of ranging zone.
The triangle pattern is broken many times from below to above and from above to below for totally ranging market condition to be going on for right now.
- if price will break 1.0876 resistance level so we may see the reversal of the price to the bullish trend to be started on this timeframe.
- if price will break 1.0847 support so the bearish trend will be continuing to be out of ranging situation.
- if not so the price will be ranging within the levels.
| Resistance | Support |
|---|---|
| 1.0876 | 1.0847 |
| N/A | N/A |
- Recommendation to go short: watch the price to break 1.0847 support level for possible sell trade
- Recommendation to go long: watch the price to break 1.0876 resistance level for possible sell trade
- Trading Summary: ranging
SUMMARY : ranging


