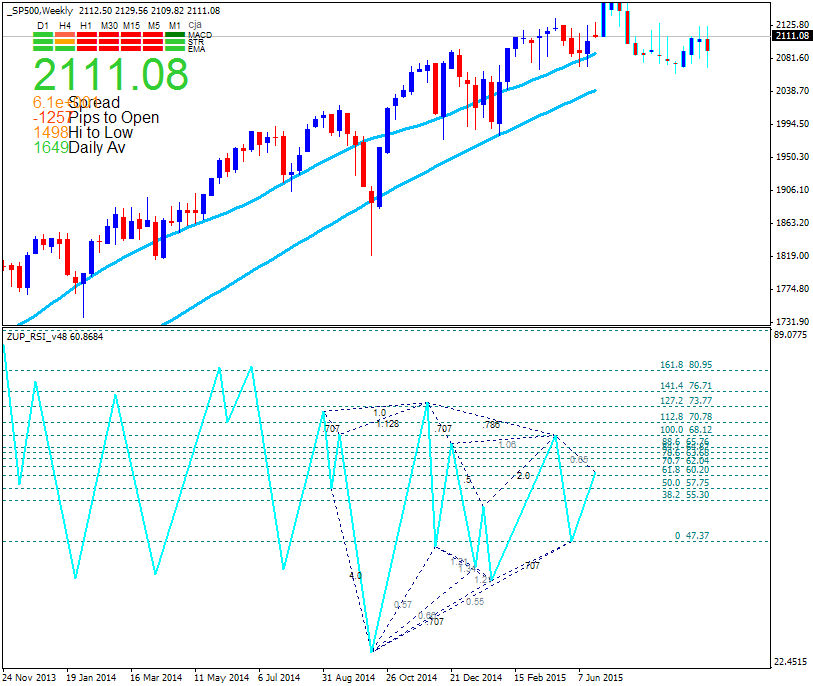
S&P 500 TECHNICAL ANALYSIS - Prices may be preparing to turn lower as negative RSI divergence hints at ebbing upside momentum. A turn below trend line resistance-turned-support at 2099.10exposes the channel floor at 2085.40.
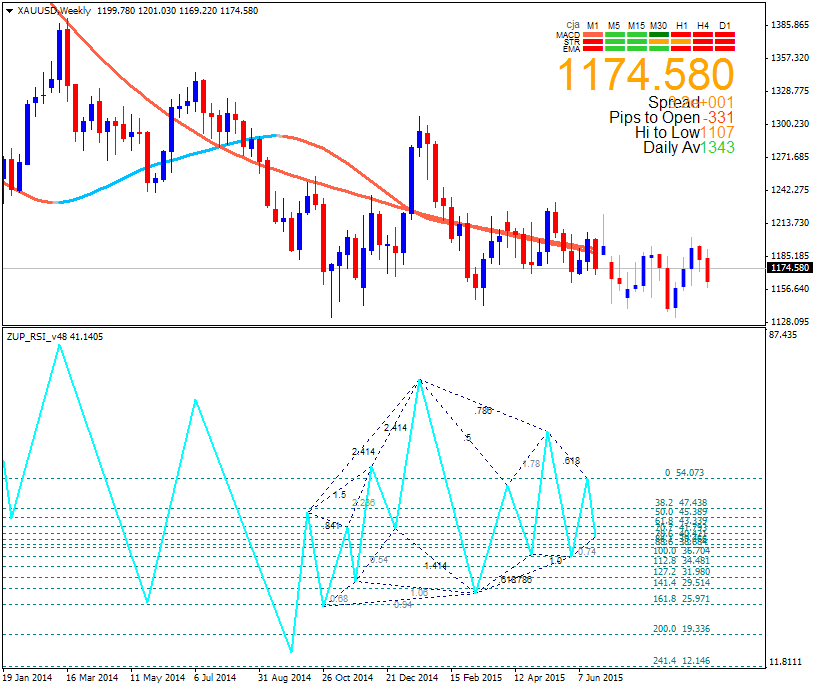
GOLD TECHNICAL ANALYSIS - Prices continued to push lower after erasing last week’s post-FOMC advance. From here, a break below the 50% Fibonacci expansion at 1170.86 exposes the 61.8% level at 1162.64.
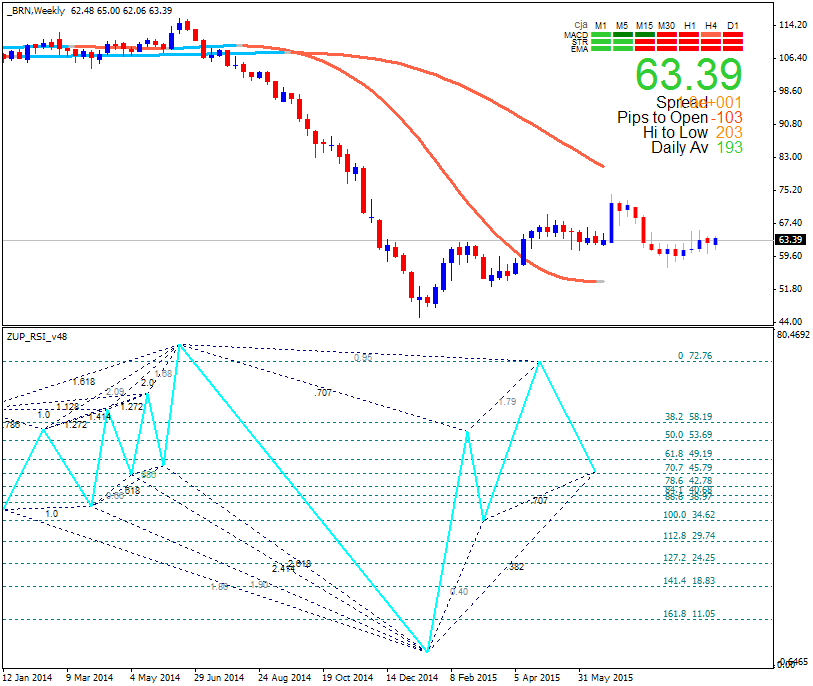
CRUDE OIL TECHNICAL ANALYSIS - Prices broke support guiding the recovery from mid-January, suggesting the longer-term down trend is resuming. From here, a break below the 38.2% Fibonacci retracement at 60.27 exposes the 50% level at 57.39. Alternatively, a move back above the trend line support-turned-resistance at 63.88 eyes the 23.6% Fib expansion at 66.69.