
Technical Analysis for US Dollar, S&P 500, Gold and Crude Oil - prices for gold is oscillating after dropping to a three-month low
10 June 2015, 16:35

0
251
US DOLLAR TECHNICAL ANALYSIS – Prices continue to mark time in a
choppy range after opening June at a seven-week high. Near-term support
is at 11887, the 38.2% Fibonacci retracement, with a break below that on
a daily closing basis exposing the 50% level at 11839.
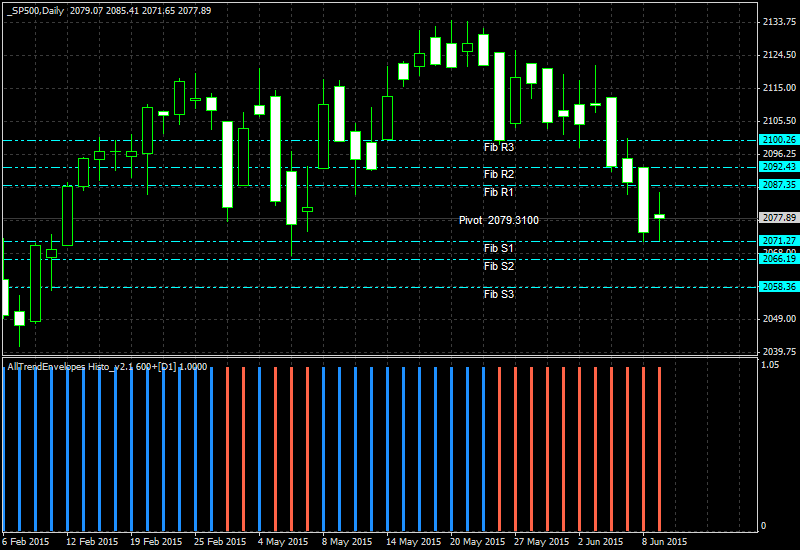
S&P 500 TECHNICAL ANALYSIS – Prices paused to digest losses after three consecutive days of downward momentum. Sellers are now challenging the 61.8% Fibonacci retracement at 2077.20, with a break below that exposing the 76.4% level at 2063.00.
S&P 500 TECHNICAL ANALYSIS – Prices paused to digest losses after three consecutive days of downward momentum. Sellers are now challenging the 61.8% Fibonacci retracement at 2077.20, with a break below that exposing the 76.4% level at 2063.00.
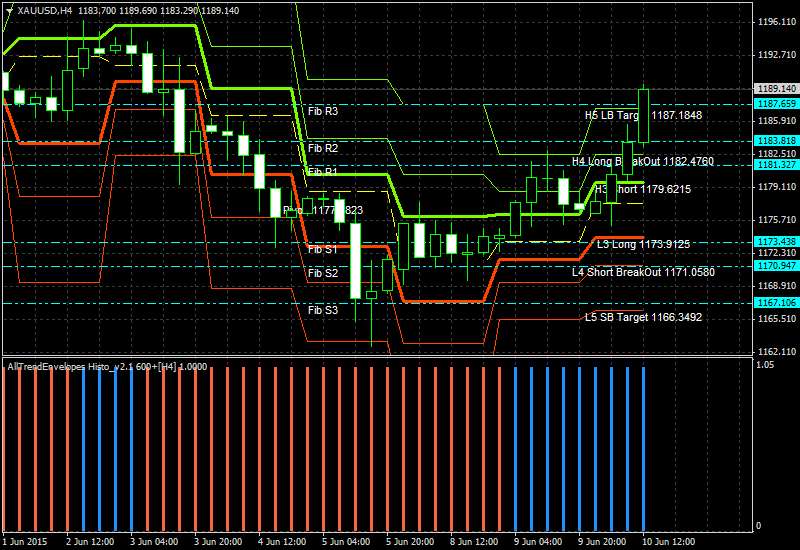
GOLD TECHNICAL ANALYSIS – Prices are digesting losses after dropping to a three-month low. A break below the 38.2% Fibonacci expansion at 1169.31 exposes the 50% level at 1149.85.
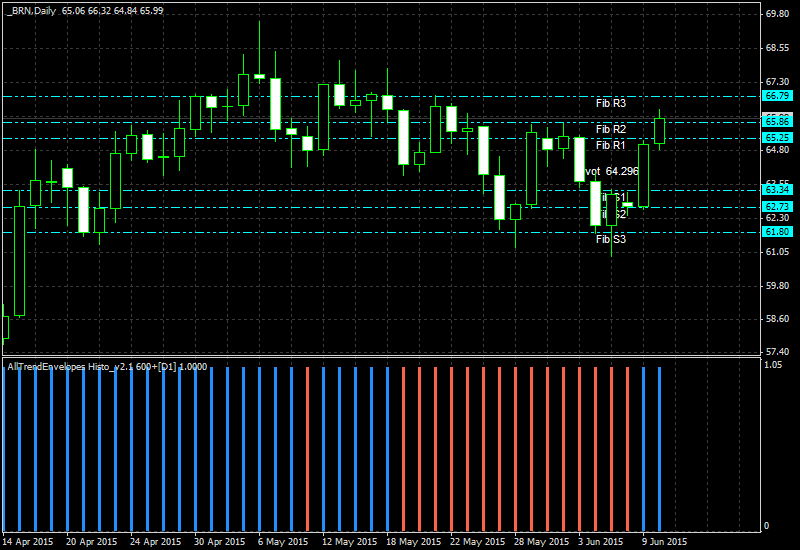
CRUDE OIL TECHNICAL ANALYSIS – Prices continue to oscillate above support at a rising trend line guiding the move higher since mid-January. A break below this barrier (now at 62.64) exposes the 38.2% Fibonacci retracement 60.27. Alternatively, a reversal above downward-sloping resistance at 65.13 targets the May 6 high at 69.60, followed by the 38.2% Fib expansion at 70.25.


")
