
Technical Analysis for US Dollar, S&P 500, Gold and Crude Oil - price for oil continues to test support at a rising trend line

Prices are consolidating in choppy range after opening June at a seven-week high. A daily close below the 38.2% Fibonacci retracement at 11887 exposes the 50% level at 11839.
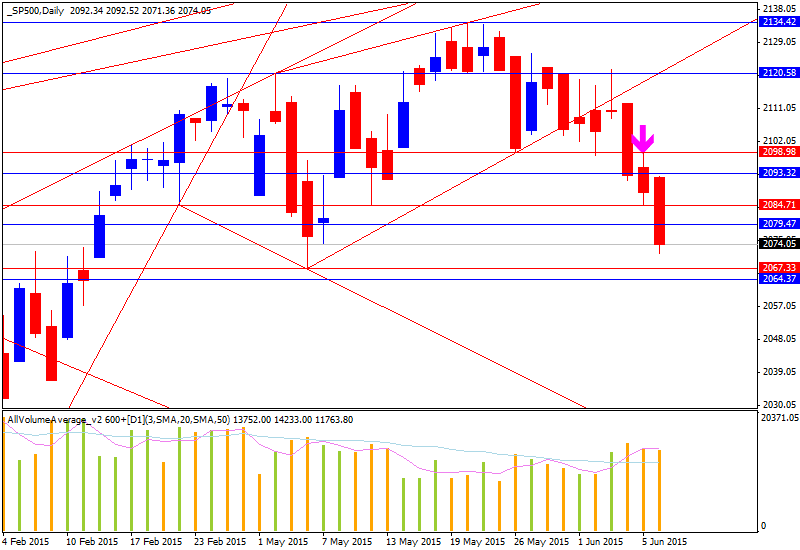
S&P 500 TECHNICAL ANALYSIS
Prices continue to push lower after breaking two-month trend support. Sellers are now challenging the 61.8% Fibonacci retracement at 2077.20, with a break below that exposing the 76.4% level at 2063.00.
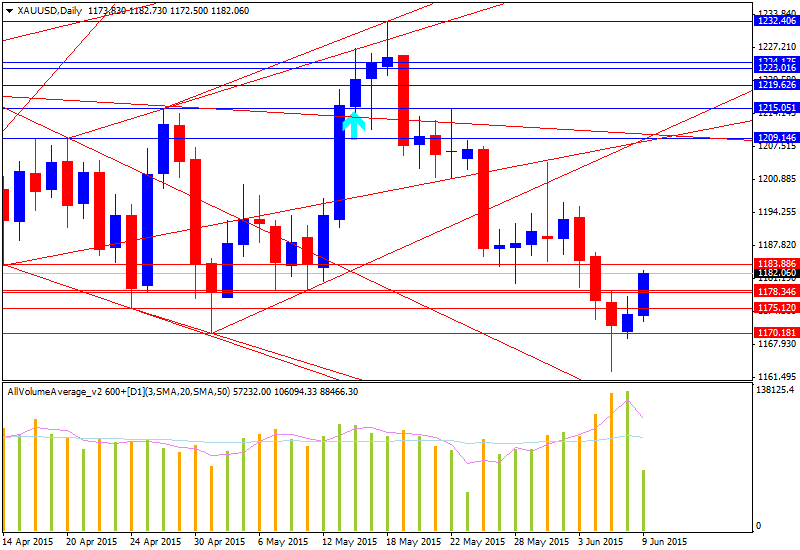
GOLD TECHNICAL ANALYSIS
Prices are digesting losses after dropping to a three-month low. A break below the 38.2% Fibonacci expansion at 1169.31 exposes the 50% level at 1149.85. Alternatively, a move above support-turned-resistance at 1178.09, the March 31 low, targets the 23.6% Fib at 1193.38.
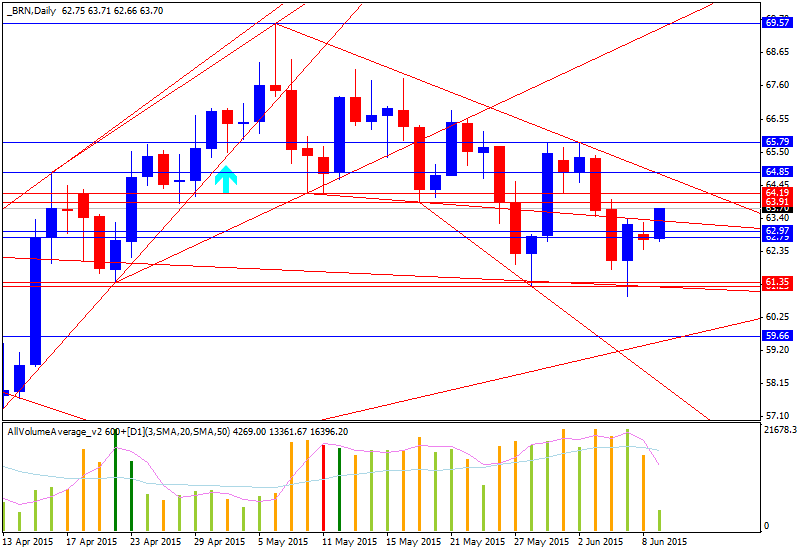
CRUDE OIL TECHNICAL ANALYSIS
Prices continue to test support at a rising trend line guiding the move higher since mid-January. A break below this barrier (now at 62.49) exposes the 38.2% Fibonacci retracement 60.27. Alternatively, a reversal above downward-sloping resistance at 65.23 targets the May 6 high at 69.60.


")

