

1. AUDIO News
John O'Donnell and special guest Jim Puplava discuss the
beauty and simplicity of Online Trading Academy's patented supply and
demand strategy. Jim also gives his views on the bond markets and
shares a story about a silver trade he made with the help of Online
Trading Academy.
2. VIDEO HowTo
An Introduction to supply and demand
Tutorial on Introduction to supply and demand for microeconomics, Principle of Economics, and good for GCSE revision.
This is very simple explanation - Supply and Demand
3. THE THEORY
What is a support?
A support level is a price level
located below the current value of price, where there were previously
more buyers than sellers (demand was previously more important than
supply), and which sent the price upwards after preventing it from
falling any lower. It is a level that the big players consider a good
price to buy. A support level, as stated earlier, is represented by a
horizontal line, which makes it simple enough for us to trade as there
is nothing simpler than a horizontal line.
Investopedia explains "Support" : If the price of a stock falls
towards a support level it is a test for the stock: the support will
either be reconfirmed or wiped out. It will be reconfirmed if a lot of
buyers move into the stock, causing it to rise and move away from the
support level. It will be wiped out if buyers will not enter the stock
and the stock falls below the support.
What is a resistance?
A resistance level is a price level
located above the current value of price, where there were previously
more sellers than buyers (supply was more important than demand), and
which sent the price downwards after preventing it from raising higher.
It is a level that institutions consider a good price to sell. A
resistance level is also represented by a horizontal line.
What do support and resistance levels look like on a chart?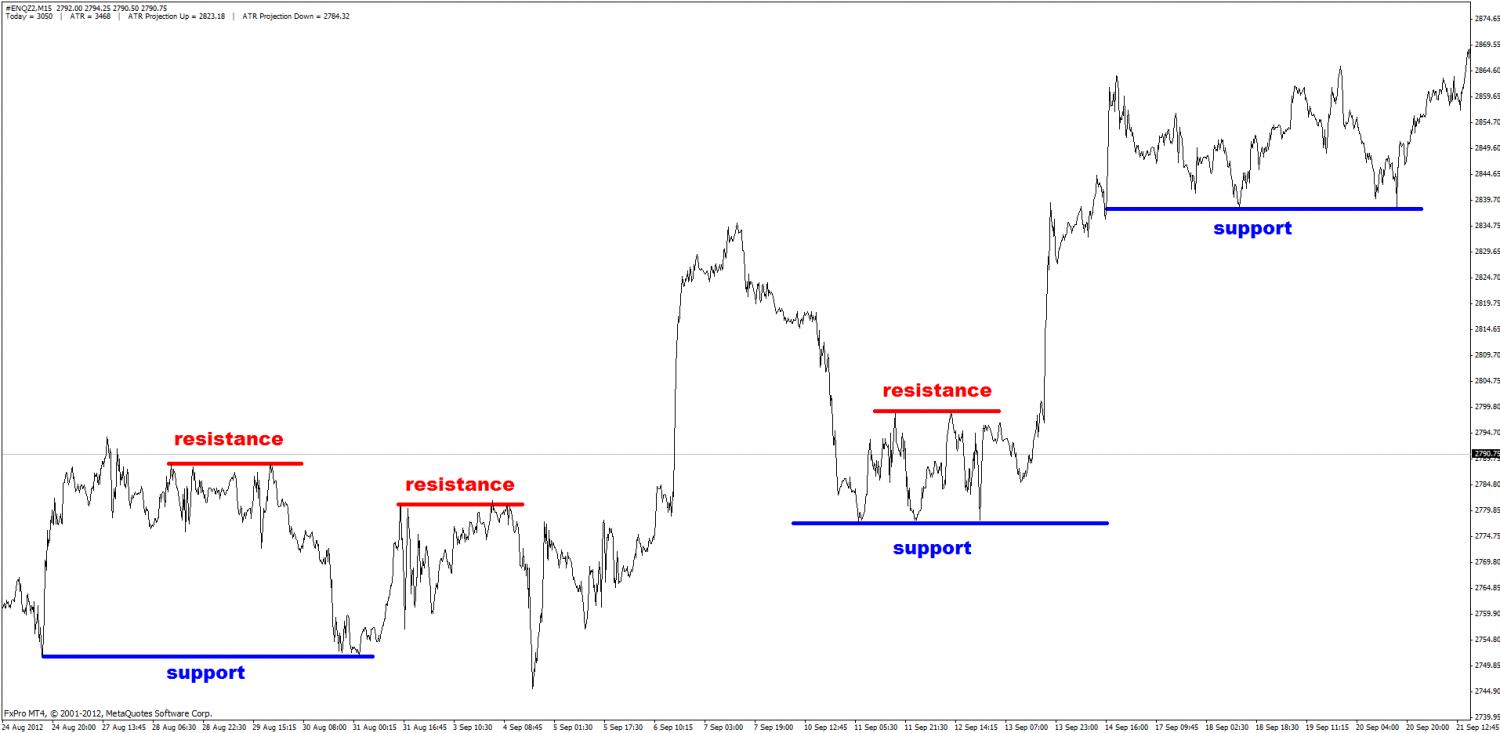
To sum-up, you can remember that support represents demand and
resistance represents supply. Bulls (buyers) put buying pressure at
support levels and bears (sellers) put selling pressure at resistance
levels. To find your support and resistance levels, observe where price
respectively stalled and started to raise or stalled and started to
drop.
Is a line enough or should you rather consider a zone?
As supply and demand traders, we like to approach the support and
resistance principle as zones/areas more than one unique line. But in
the end, a zone is made of two lines, so let us say that we like to use
two lines instead of one. This is because you will see that although
price can respect a single line very nicely, it can also turn a bit
above or a bit below the initial price line.
Investopedia explains "Zone of support": A price zone in
which a stock finds support and begins to trade upward once again. In
technical analysis, support occurs not at a finite point, but in a
zone. The "density" of the zone of support (how far the price can move
down through it) depends on the volume of trading as the price
approaches and enters the zone. The higher the volume of trading in the
zone of support, the higher the point at which actual support will most
likely occur.
Investopedia explains "Zone of resistance": A price zone in
which a stock finds resistance and begins to trade downward. In
technical analysis, that support occurs not at a finite point, but in a
zone. The "density" of the zone of resistance (how far up the price
can move through it), depends on the volume of trading as the price
approaches and enters the zone. The higher the volume of trading in the
zone of resistance, the lower the point at which the actual resistance
will most likely occur.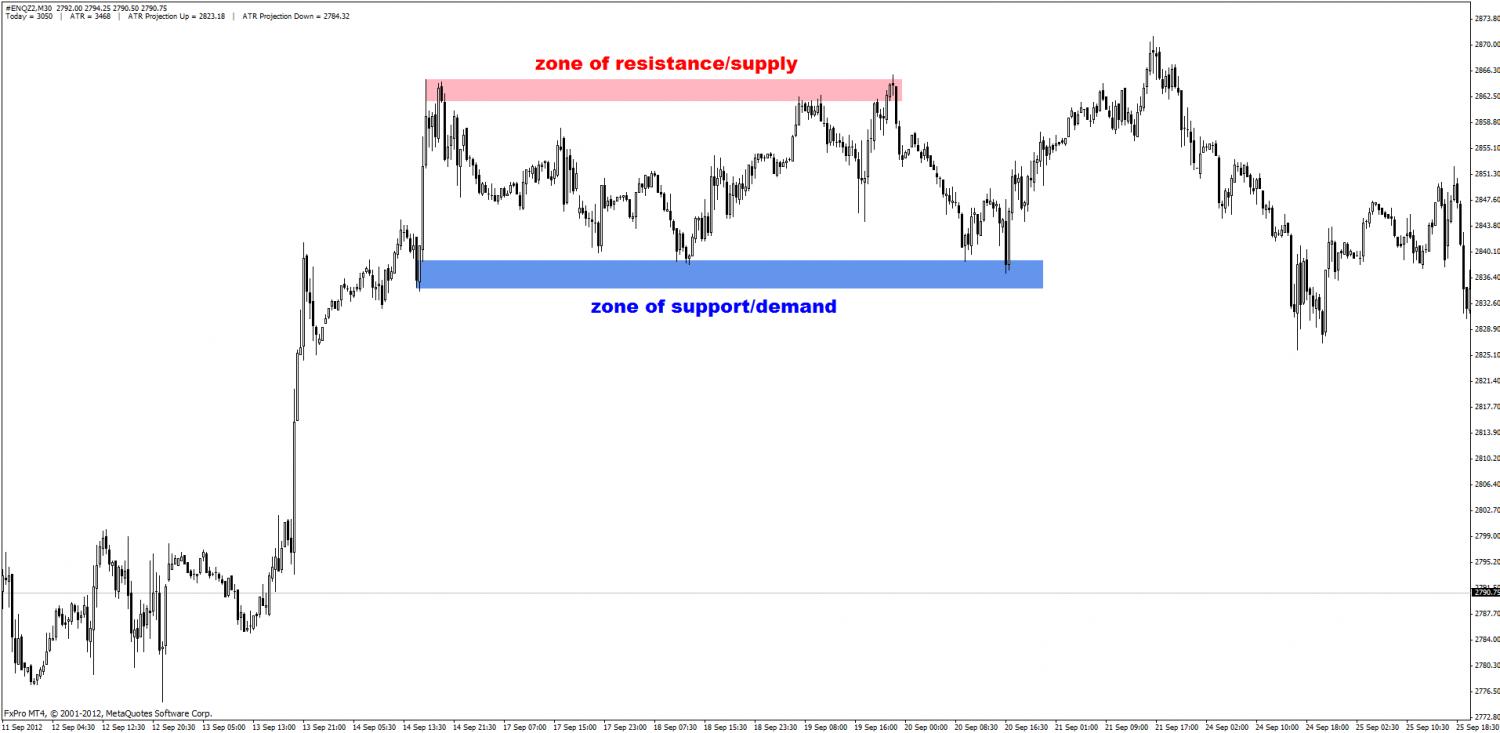
Why does it work?
Support and resistance levels are the
simplest yet the most effective tools to trade profitably. But why?
Well, there are two answers to that. The first one is mechanical and
results from the human psyche. Greed, to be more precise. Let us put it
this way: if you go to the store at 8h00 in the morning to buy a
diamond, and you see the price is 1000 usd. You tell yourself, well, I
do not know if I am ready to pay this price for a diamond. I will think
about it and come back later. You come back at noon, and the diamond
now costs 1300 usd! Damn, you think, I should have bought it when it
was at 1000usd! Now it is too expensive anyway. I will come back later.
You come back at 4.00pm, and the diamond now cost 1000usd again!
Fantastic, I am so lucky, I am a buyer! Except you are not the only one
willing to buy at 1000usd now, there plenty of other buyers who
unfortunately missed the first train in the morning. Consequently, a
massive demand for the diamond at 1000usd will result in a lot of
buyers purchasing the diamond, reducing the supply and sending the
price up again. On a chart, you could draw a horizontal line at 1000usd
at 8.00am and wait for the price to come back to it. In this example,
the support level for the diamond was at 1000usd.
The second reason is not as rational as the first one. Because the
market considered the above story to be true, it acted consequently
again and again, for years and years. So now, it is just working by
itself. Some call it a self-fulfilling prophecy. These levels are so
widely accepted in the trading community that they are closely
monitored and are likely to be significant and to have a serious effect
on the price.
Now try to think about it when looking at the two charts below. Support / Demand
In the Gold H4 chart below, you can see that price went up a first
time because the market decided it was a cheap price to buy. This is
the most crucial information. This is almost everything you need to
know. Did you miss the first move up? Yes, but you were not the only
one. See how price reacts when coming back to the support level? It
rises. In the first zone, price comes back several times, never really
deep (meaning bulls are impatient to buy and do so even a tad higher
than the lower level where the price comes from), and goes up again.
Buyers show up every time, before it goes up for good. The second zone
is even better as price leaves it faster and higher. This is an
indication that is good support, meaning a very good price to buy it
at. What happens next is obvious.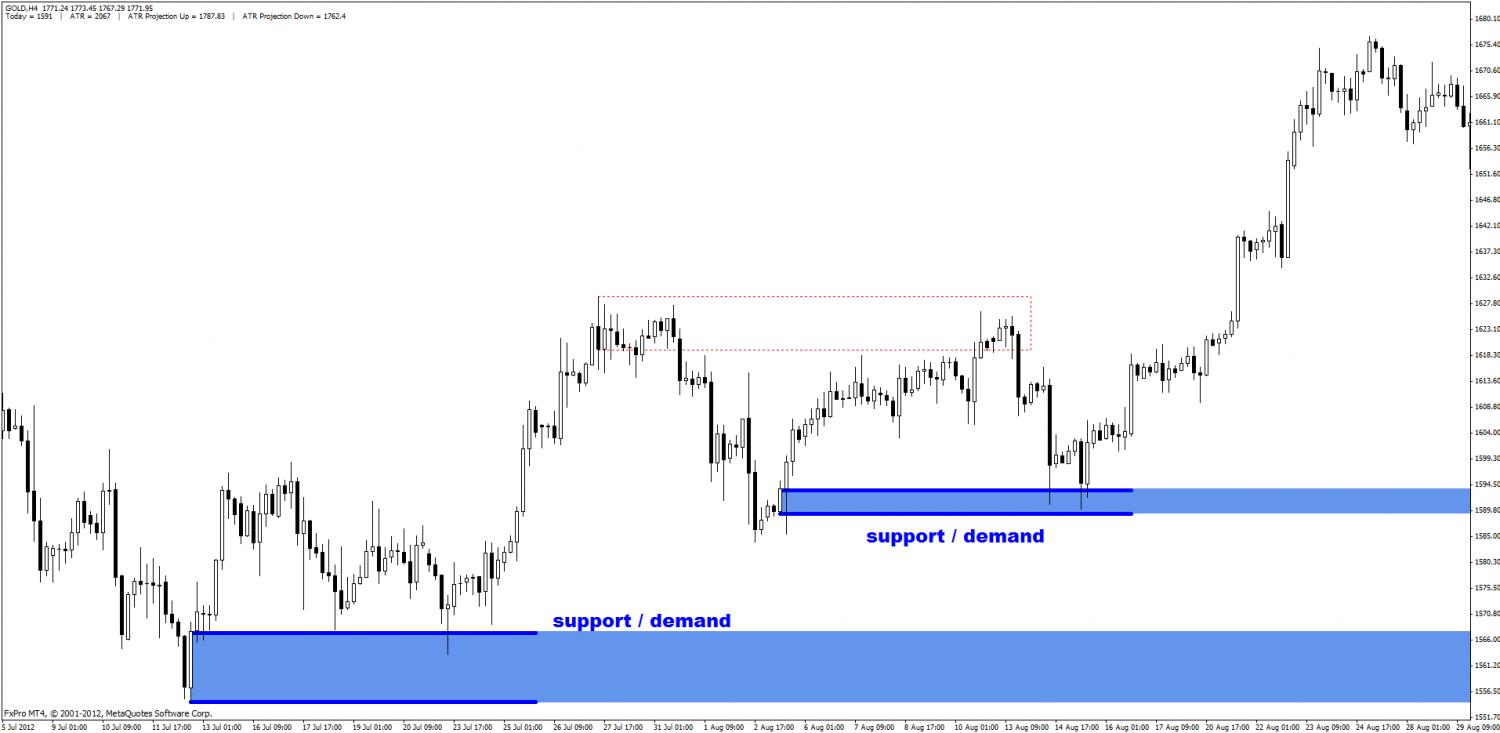
Resistance / Supply
In the CAC40 futures (French stocks)
chart below, you can see that price climbs to a very clear level of
resistance, where supply was obviously stronger than demand in the past.
This imbalance between supply and demand sent the price down
violently. When resistance is reached, sellers who have been waiting to
sell again at this nice opportunity do so and price drops. But you
also need to realize that because it is a self fulfilling prophecy,
buyers know that sellers are waiting at this level. And because they do
not want to see their profits vanish if price goes down, they close
their position, going from buyers to sellers (to liquidate a position
means to invert the action you initially did to enter the market. They
are mechanically sellers when they close their positions because if
they were buyers, they need to sell it to someone. Most of the time, to
retailers.) So new sellers + buyers closing their orders = massive
drop. In this case it is not a resistance, it is an iron wall.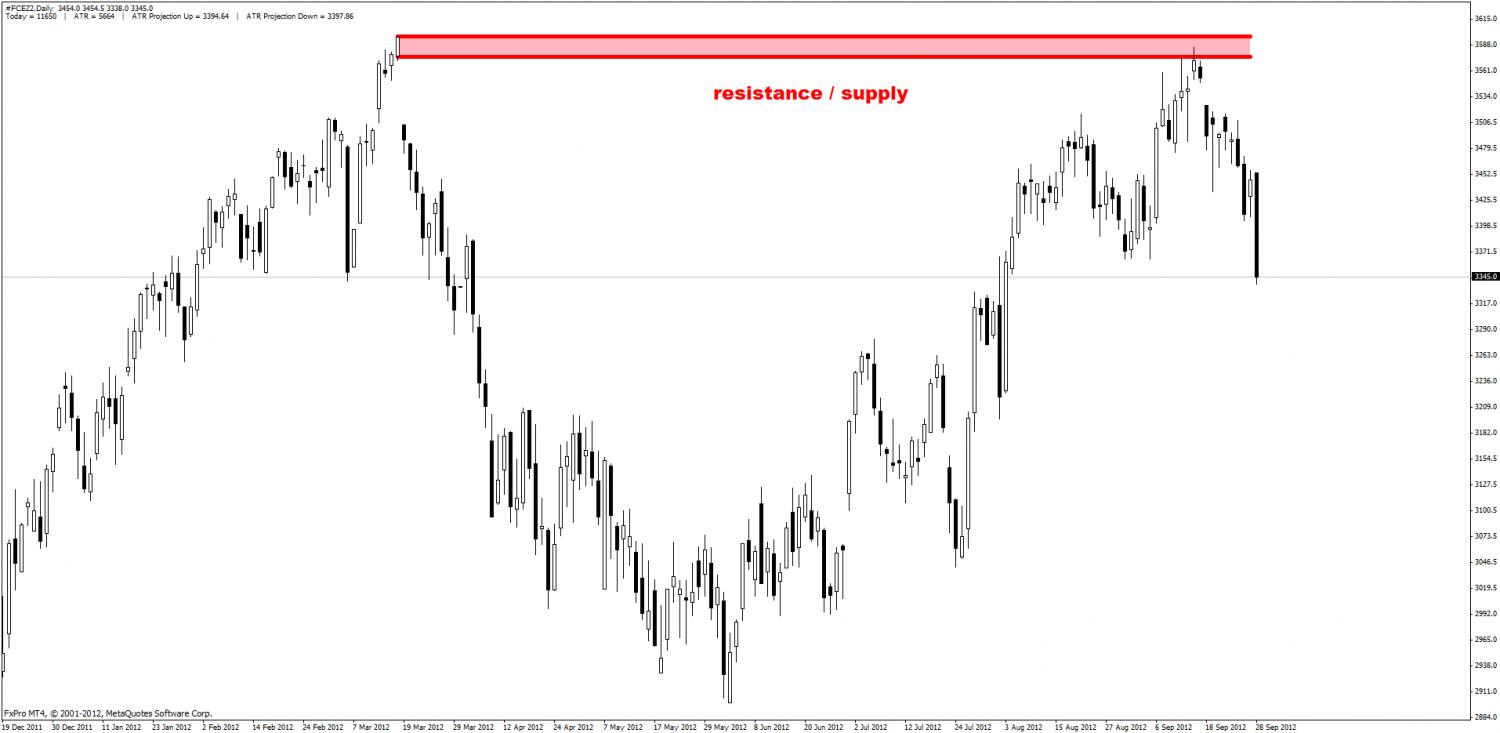
To finish with these general principles, it is also good to know that
when price moves sideways, buyers and sellers are quite happy with the
level the price is at. Supply and Demand are fairly equal. Bulls and
Bears just send each other the ball until bulls violently throw the
ball at the bears' face or vice-versa.
Summary
Buyers and sellers create two opposing forces
that move prices. Buyers want to buy cheap and then sell more
expensive. They use support lines / areas to know where price is cheap.
Sellers, in the contrary, are always looking to sell expensive to buy
cheaper afterwards. They use resistance lines / areas to know where
price is expensive. When everybody is happy, prices moves sideways. The
fact that some precise price levels have been significant in the past
is telling us that they may have sufficient impact on price movements
in the future. Sometimes, levels of support and resistance are very
clear on the charts and remain valid for a long time. Price has a good
memory, write it down and never forget it. If you keep this in mind,
you have a great advantage on other traders. Is it that simple?
Yes and no (but more yes than no). You see, if price was only
travelling from one line of support to one line of resistance and
vice-versa, every trader would be rich and retired! So although support
and resistance lines (demand and supply areas) can work for a long
time, they eventually become invalid. How do we know they become
invalid? They just get broken! This is the moment when you go long at
support and price gets below it and you scream "Gadzooks!" or anything
else appropriate in this case. In reality, what was a good price to buy
(a support) may weaken until the price finally breaks down and what was
a good price to sell (a resistance) may weaken until the price finally
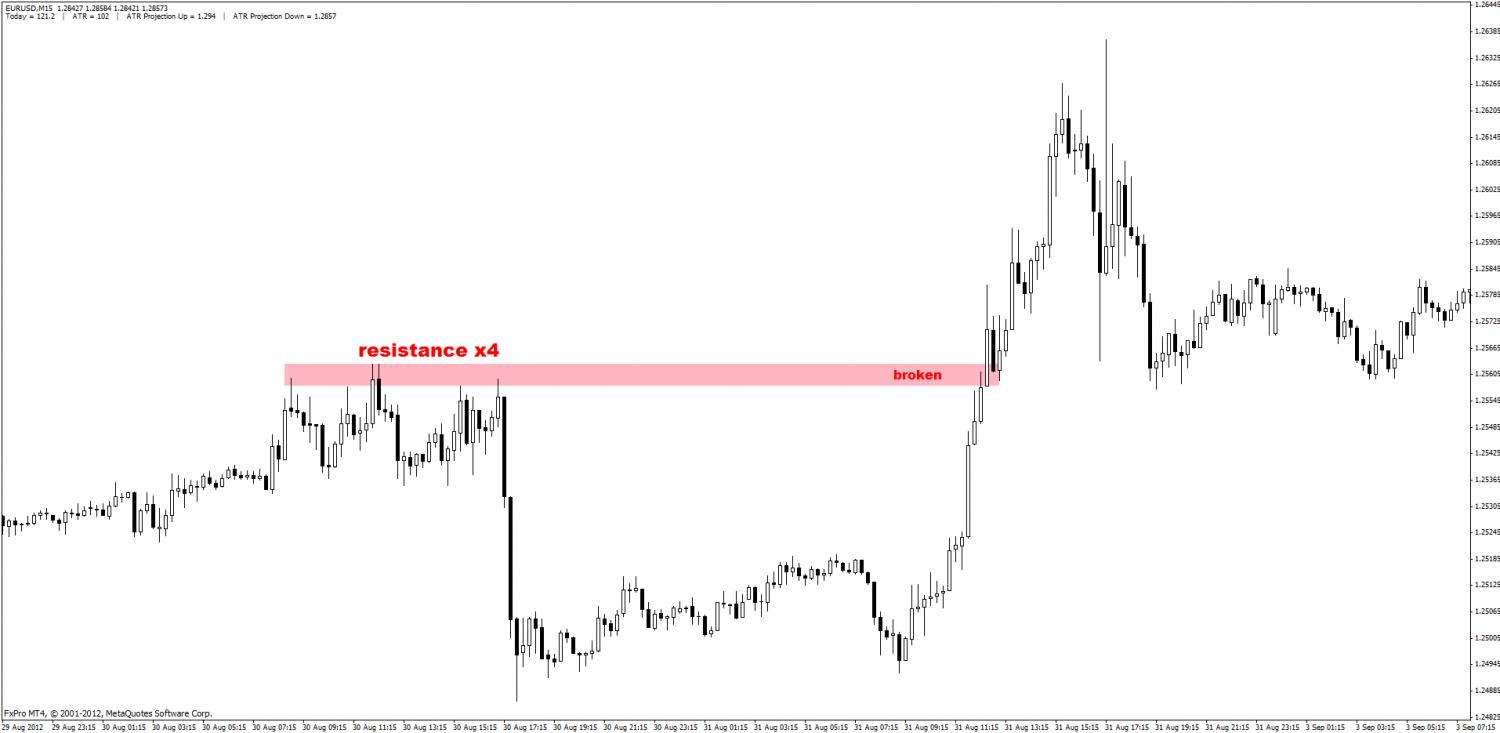
breaks up. In the EUR/USD chart below, resistance held for a time and
rejected price 4 times before eventually getting broken. It simply
means that supply was exhausted and demand was stronger. It does not
mean to be a terrific amount of demand, it can just be that there a
very small amount of sellers willing to sell again at this price.
Always think about the imbalance between buyers and sellers.
So now what?
Now you must have understood that price
raises until sellers judge it is a good enough price to sell, and price
drops until buyers judge it is a good enough price to buy. When price
breaks a resistance level and reaches new peaks, this means that buyers
have increased their expectations and are now willing to buy at higher
prices. Sellers, in the contrary, will wait for a better price to sell
and will let the buyers control the market. When price breaks a support
level and makes new lows, this means that sellers are now willing to
sell at lower prices. Buyers will step out and wait better level to buy,
hence leaving the markets at the bears' mercy.
Your mission is very simple. Observe price action in the areas
of interest, around support and resistance, and train your eyes to see
if there are any signs of reaction that could end up in a reversal or
in a breakout.


")
