

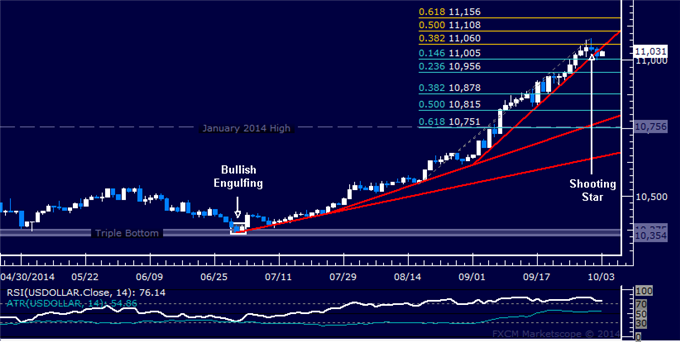
US DOLLAR TECHNICAL ANALYSIS
Prices pulled back as expected after
putting in a Shooting Star candlestick. A daily close below the 14.6%
Fibonacci retracement at 11005 exposes the 23.6% level at 10956.
Alternatively, a reversal above the 11048-60 area marked rising trend
line support-turned-resistance and the 38.2% Fib expansion clears the
way for a test of the 50% threshold at 11108.
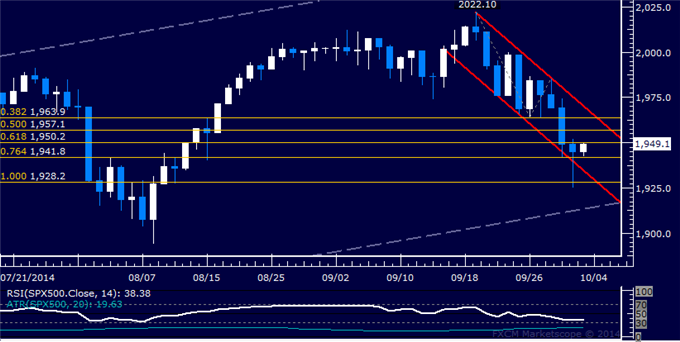
S&P 500 TECHNICAL ANALYSIS
Prices are testing support at 1941.80,
the 76.4% Fibonacci expansion, with a break below that exposing a
falling channel floor at 1934.90 and the 100% level at 1928.20.
Alternatively, a reversal above the 61.8% Fib at 1950.20 aims for the
50% expansion at 1957.10.
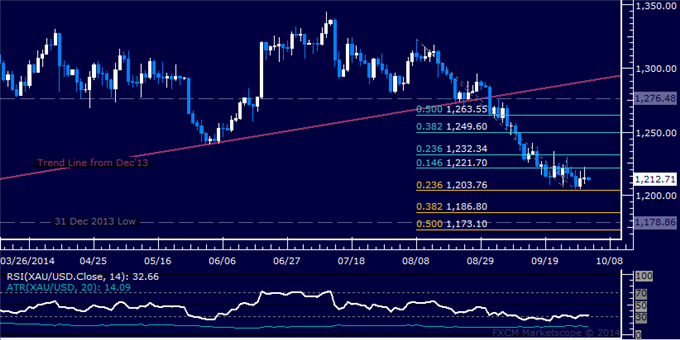
GOLD TECHNICAL ANALYSIS
Prices are treading water below resistance at
1221.70, the 14.6% Fibonacci retracement. A break above that on a daily
closing basis exposes the 23.6% level at 1232.34. Alternatively, a
reversal below the 23.6% Fib expansion at 1203.76 aims for the 38.2%
threshold at 1186.80.
CRUDE OIL TECHNICAL ANALYSIS
Prices edged past support at 95.11, the
23.6% Fibonacci expansion, to challenge falling channel floor support at
93.91. A break below that exposes the 38.2% level at 92.34.
Alternatively, a turn back above the 95.11 eyes the 96.73-82 area,
marked by the April 18 2013 low and the 14.6% Fib.


")
![[XAUUSD]: Weekly Liquidity Activation Points (timings), June 22-26, 2026](https://c.mql5.com/6/1013/splash-preview-771790.png "[XAUUSD]: Weekly Liquidity Activation Points (timings), June 22-26, 2026")
