

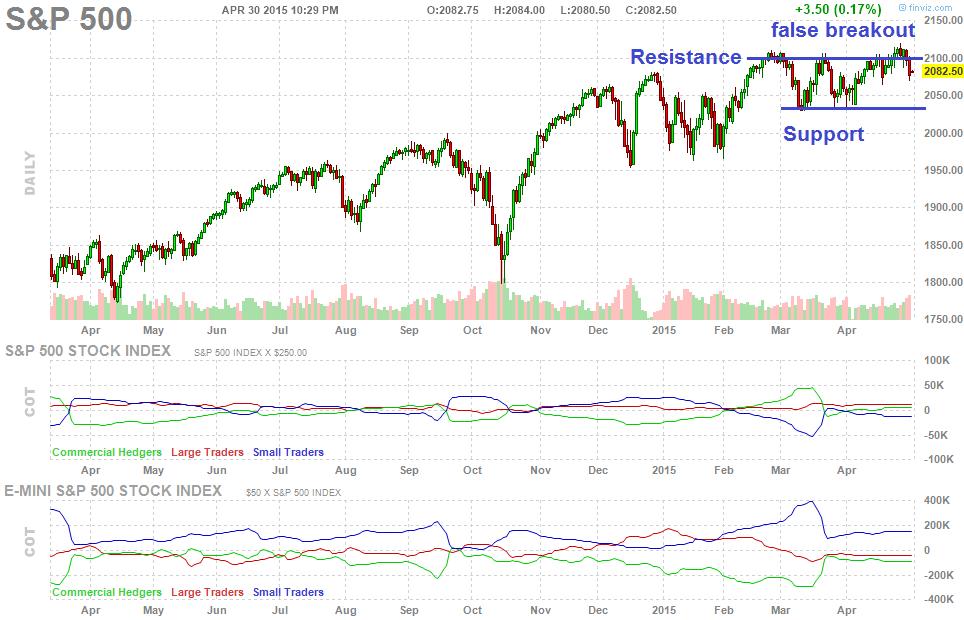
S&P 500 attempted to break above 2,100 resistance level but that breakout was thwarted in the past few days when the index sliced back below this level. S&P 500 is back in its trading range between its recent highs and recent lows. This range needs to be broken:
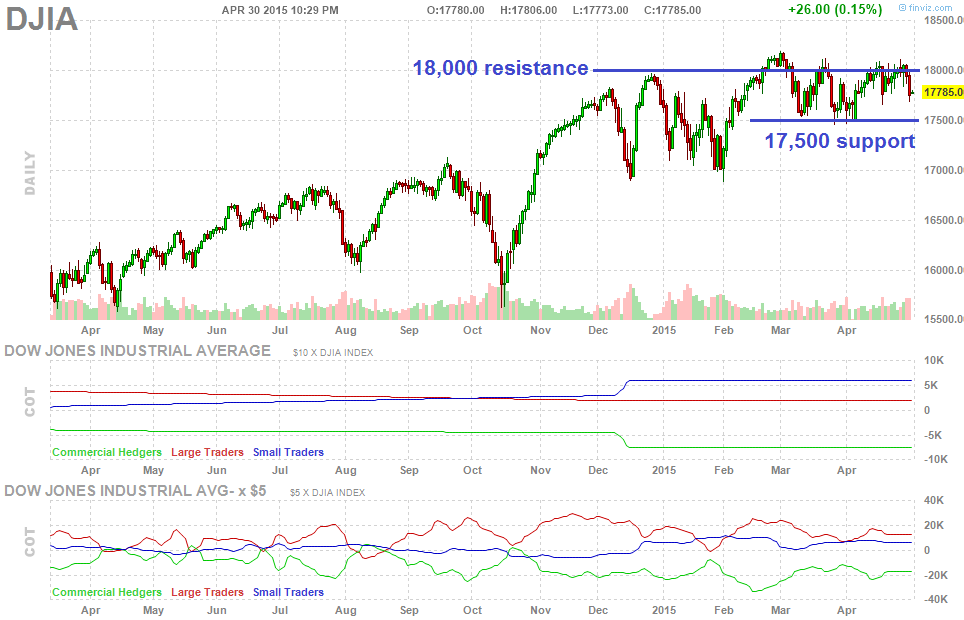
Dow Jones is in a trading range between approximately 17,500 and 18,000. The Dow has tried to break above its 18,000 resistance:
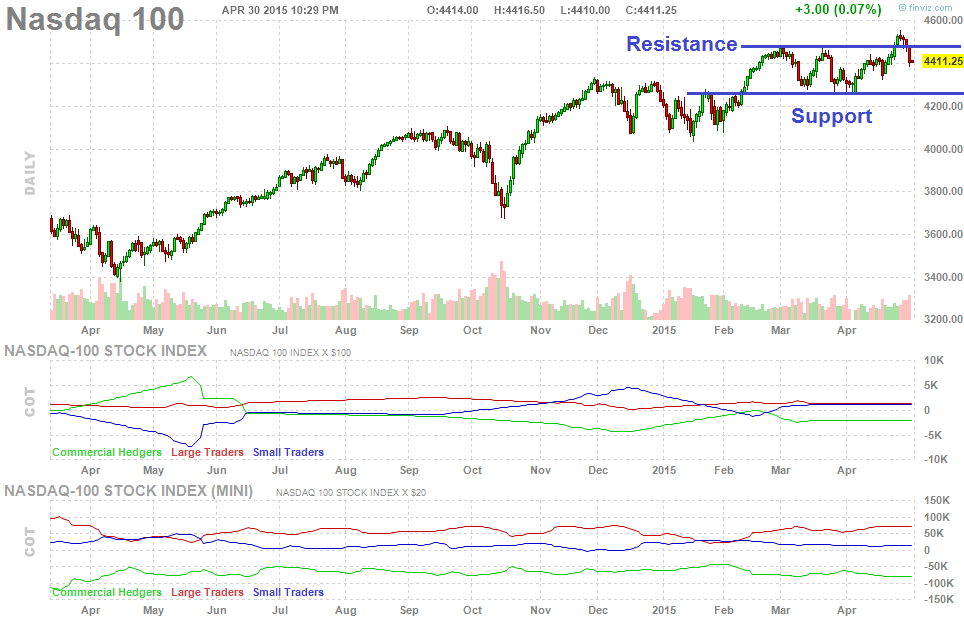
Nasdaq 100 experienced a false breakout last week and is now back in its prior trading range:
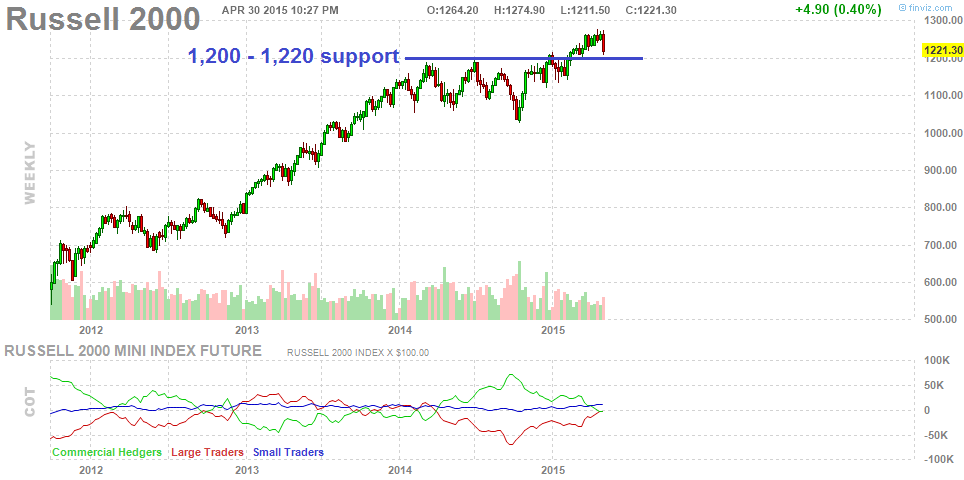
Russell 2000 has corrected back to its 1,200 support level that needs to hold in order for the uptrend to stay intact:
The strong downside momentum of the past few days increases the probability that U.S. stock indices will try to re-test the lows that were reached in March and early-April. Several stock indices attempted to launch bullish breakouts above key technical levels, but those breakouts have failed after stocks sold off sharply


")
