
Technical Analysis for US Dollar, S&P 500, Gold and Crude Oil - confirmation is required on a daily close below 1185.23 for gold

US DOLLAR TECHNICAL ANALYSIS
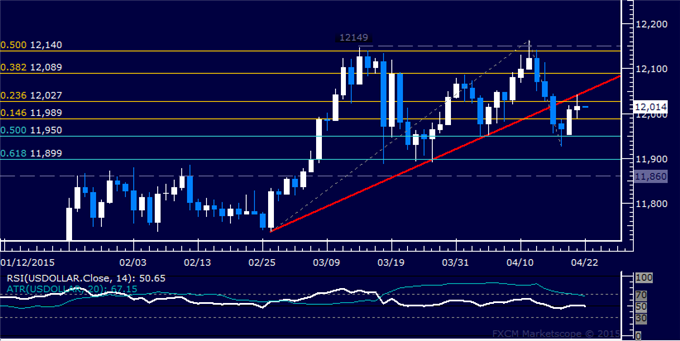
Prices stalled on a retest of a
pivotal trend line after correcting upward from a monthly low. Near-term
resistance is in the 12027-49 area (23.6% Fibonacci expansion, trend
line), with a break above that on a daily closing basis exposing the
38.2% level at 12089.
S&P 500 TECHNICAL ANALYSIS
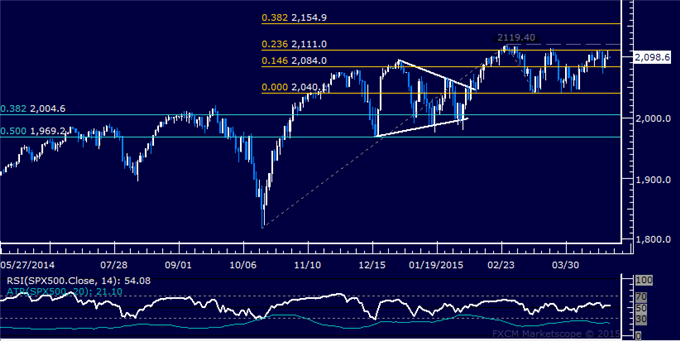
Prices continue to hover below
resistance in the 2111.00-19.40 area (23.6% Fibonacci expansion,
February 25 high). A break above that on a daily closing basis exposing
the 38.2% level at 2154.90.
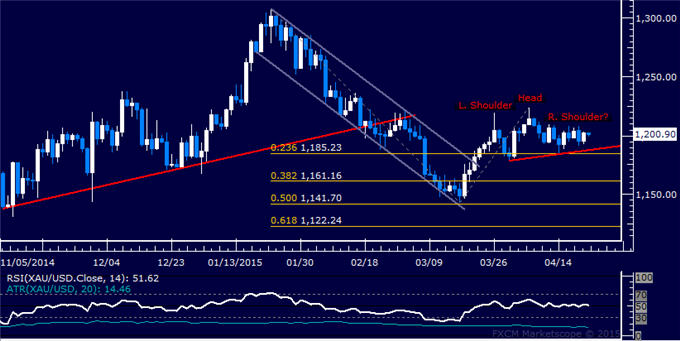
GOLD TECHNICAL ANALYSIS
Prices may be carving out a bearish
Head and Shoulders top chart pattern. Confirmation is required on a
daily close below 1185.23, the 23.6% Fibonacci expansion, with the first
downside target thereafter coming in the 38.2% level (1161.16).
Near-term resistance is at 1224.15, the April 6 high.
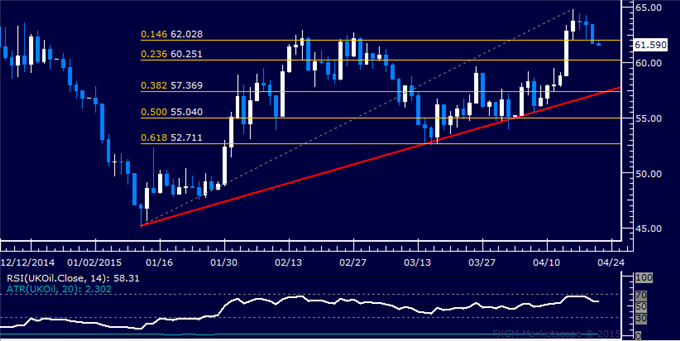
Prices turned lower anew having found resistance below the $65/barrel figure. Near-term support is at 60.25, the 23.6% Fibonacci retracement, with a break below that on a daily closing basis exposing the 38.2% level at 57.37. Alternatively, a move back above the 14.6% Fib at 62.03 targets the April 16 high at 64.91.


 & AMD Framework")

")