
USDCAD Technical Weekly Fibo Analysis: marked a top with bearish Dark Cloud Cover and Bearish Engulfing candlestick patterns
22 April 2015, 15:11

0
900
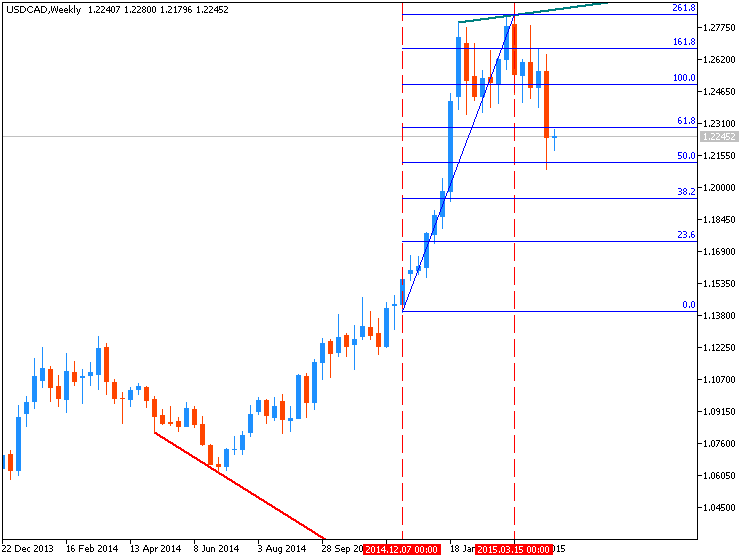
The US Dollar declined against its Canadian counterpart as expected
having marked a top with bearish Dark Cloud Cover and Bearish Engulfing
candlestick patterns as well as negative RSI divergence. Support is now
at 1.1949, the 38.2% Fibonacci retracement, with a break below that
exposing the 23.6% level at 1.1737. Alternatively, a turn back above at 1.2366 targets the March swing high at 1.2834.
The overall USDCAD trend continues to favor the upside. With that in
mind, we will look to current weakness as an opportunity to establish a
long position at more attractive levels once the downswing is exhausted.
| Resistance | Support |
|---|---|
| 1.2834 (W1) | 1.2087 (W1) |
| N/A | 1.1041 (W1) |


")
")