

Volatility measures how large the upswings and downswings are for a particular currency pair. When a currency’s price fluctuates wildly up and down it is said to have high volatility. Whereas a currency pair that does not fluctuate as much is said to have low volatility. It’s important to note how volatile a currency pair is before opening a trade, so we can take that into consideration with picking our trade size and stop and limit levels.
Bollinger Bands®
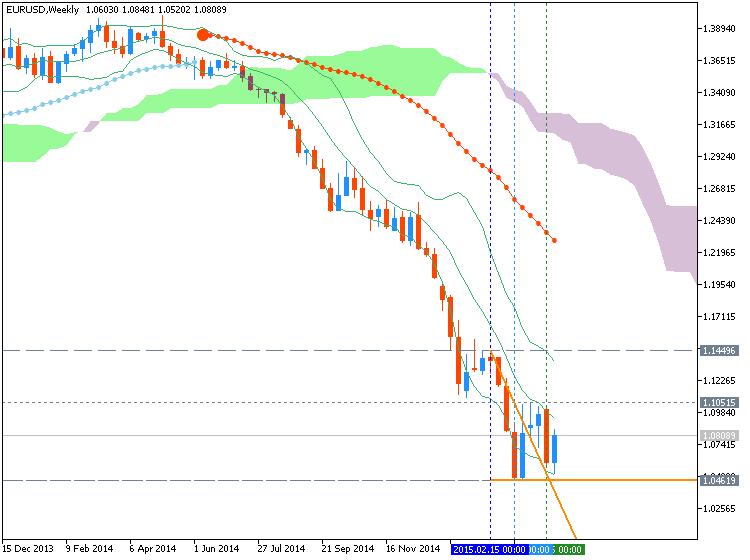
Bollinger Bands print 3 lines directly on top of the price chart. The middle ‘band’ is a 20-period simple moving average with an upper and low ‘band’ that are drawn 2 standard deviations above and below the 20 MA. This means the more volatile the pair is, the wider the outer bands will become, giving the Bollinger Bands the ability to be used universally across currency pairs no matter how they behave. The wider the bands, the more volatile the pair. Most common uses for Bollinger Bands are trying to trade double tops/bottoms that hit an upper or lower band or looking to trade bounces off an outer band in the direction of the overall trend.
ATR
The Average True Range tells us the average distance
between the high and low price over the last X number of bars
(typically 14). This indicator is presented in pips where the higher the
ATR gets, the more volatile the pair, and vice versa. This makes it a perfect tool to measure volatility and also can be a huge help when selecting where we should set our stop losses.


")
![[XAUUSD]: Weekly Liquidity Activation Points (timings), June 22-26, 2026](https://c.mql5.com/6/1013/splash-preview-771790.png "[XAUUSD]: Weekly Liquidity Activation Points (timings), June 22-26, 2026")
")