
How To Trade - Pivot Points Indicator Indicator and How Does It Work

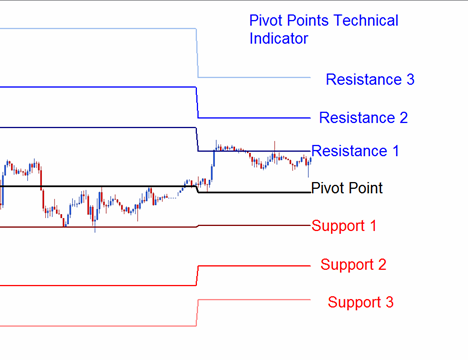
Pivot points indicator consists of a central pivot which is surrounded by 3 resistance levels below and 3 support levels above.
Pivot points initially were used by floor traders to analyze and trade the equities and futures exchange markets. This indicator is considered to be a leading indicator rather than a lagging indicator.
Pivots provide a quick way for currency traders to analyze the general trend of how the market is going to be moving during the course of the day. This indicator uses only a few simple calculations to plot the resistance and support levels.
To calculate the pivot points for the coming trading day is the previous day's
- high,
- low, and
- close prices are used
The Forex trading day closes at 5:00PM EST this daily closing time is when the pivots are updated.
The 24-hour cycle pivots for this indicator are calculated using a complex formula, which the indicator will calculate automatically for you. The central pivot is then used to calculate the support and resistance levels as follows:
- Resistance 3
- Resistance 2
- Resistance 1
- Pivot Point
- Support 1
- Support 2
- Support 3
Pivots can be used in different ways to generate Forex trading signals. The following methods are the most common technical analysis for Pivot points.
Trend Identification Signals
The central pivot is used by traders to determine the general market trend direction. The trades taken will only be in the direction of the market trend.
- Buy signal- price is above the central pivot
- Sell signal- price is below the central pivot
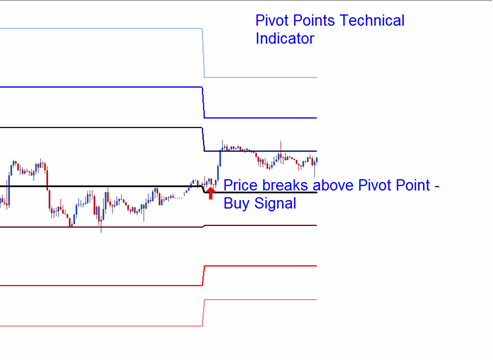
Price Breakout Signals
Price breakout signals are generated as follows
- Buy signal- is generated when the price breaks upwards through the central point.
- Sell signal- is generated when the price breaks downwards through the central point.
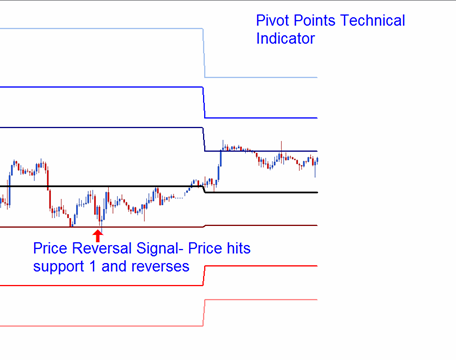
Price Reversal Signal
Price reversals are generated as follows
- Buy signal- when price moves down towards one of the support level, then touches the support or moves slightly through it then quickly reverses and moves upwards.
- Sell signal- when price moves up towards one of the resistance level, then touches the resistance or moves slightly through it then quickly reverses and moves downwards.
Setting Stop loss and Limit Profit Values using Support & Resistance Levels
The central pivotand the other support and resistance levels are used by traders to determine suitable stop loss and limit profit levels.
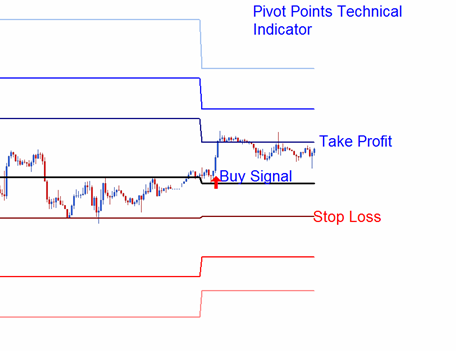
If a buy is placed above the central pivot point the Resistance 1 or
Resistance 2 can be used to set the take profit level, and the Support 1
can be set as the Stop Loss Level for the trade.


")
![[XAUUSD]: Weekly Liquidity Activation Points (timings), June 22-26, 2026](https://c.mql5.com/6/1013/splash-preview-771790.png "[XAUUSD]: Weekly Liquidity Activation Points (timings), June 22-26, 2026")
