

RSI is one of the most popular indicators used in technical analysis.
RSI indicator plots the divergence and convergence of
moving averages. The RSI is constructed using moving average analysis.
Moving Average Convergence/Divergence is a trend-following indicator.
It indicates the correlation between two moving averages.
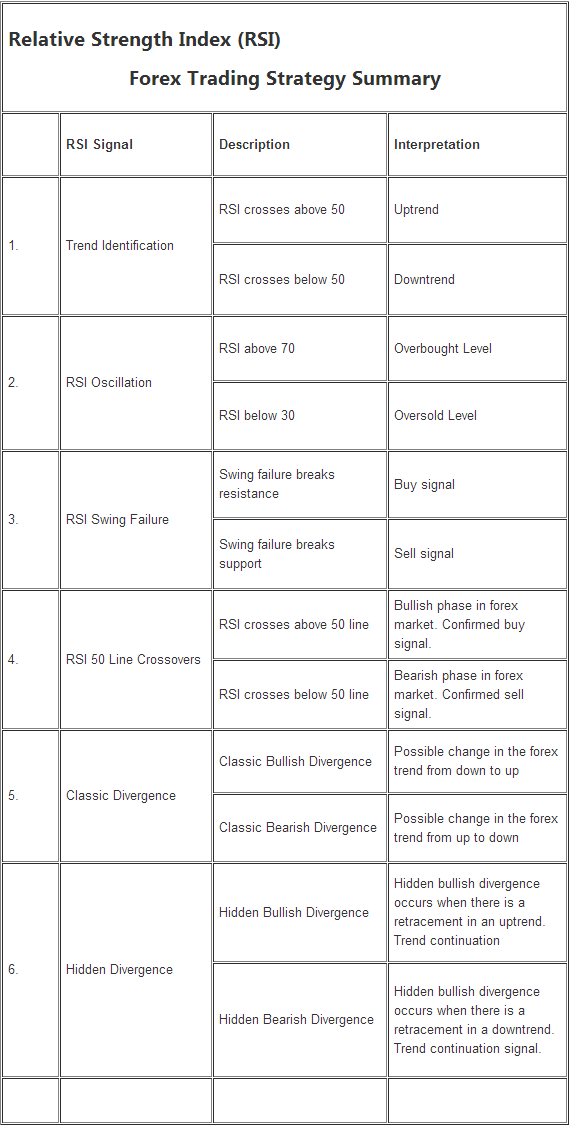
- The centerline for the RSI is 50,crossover of the centerline indicate shifts from bullish to bearish and vice versa.
- Above 50, the buyers have greater momentum than the sellers and price of a currency will keep going up as long as RSI stays above 50.
- Below 50, the sellers have greater momentum than the
buyers and price of a currency will keep going downwards as long as RSI
stays below 50.


")