Technical Analysis for S&P 500, Gold and Crude Oil - Prices launched sharply higher, with buyers attempting to clear a path above $60/barrel figure

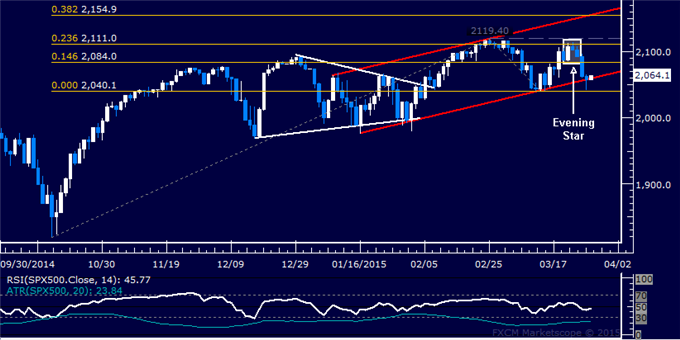
S&P 500 TECHNICAL ANALYSIS
Prices declined as expected
after putting in a bearish Evening Star candlestick pattern below
February’s swing high. A daily close belowchannel floor support at
2058.50 exposes the March 12 low at 2040.10.
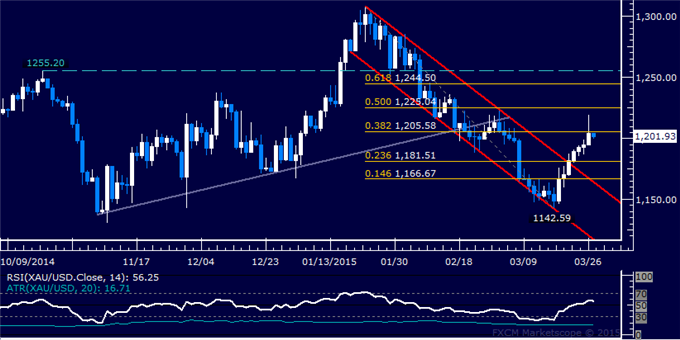
GOLD TECHNICAL ANALYSIS
Prices secured a foothold above the
$1200/oz figure as expected. A daily close above the 38.2% Fibonacci
retracement at 1205.58 exposes the 50% level at 1225.04. Alternatively, a
turn below the 23.6% Fib at 1181.51 targets the 14.6% retracement at
1166.67.
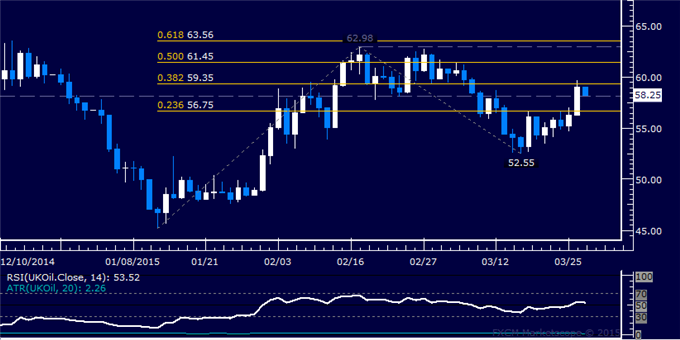
CRUDE OIL TECHNICAL ANALYSIS
Prices launched sharply higher,
with buyers attempting to clear a path above the $60/barrel figure. A
daily close above the 38.2% Fibonacci expansion at 59.35 exposes the 50%
level at 61.45. Alternatively a reversal below a horizontal pivot at
58.17 targets the 23.6% Fib at 56.75.