Technical Chart Patterns Analysis for US Dollar, S&P 500, Gold and Crude Oil - Gold to $1200, Crude Oil Recovery and US Dollar in Consolidation

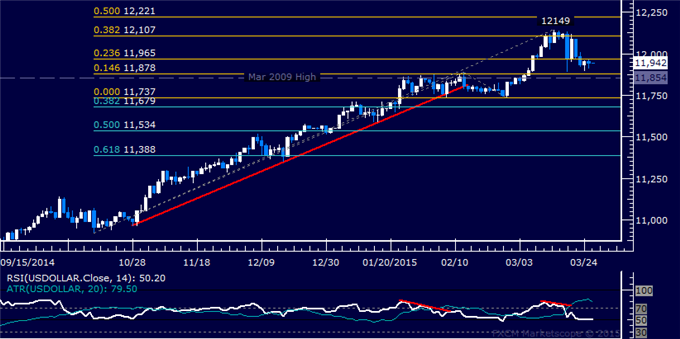
US DOLLAR TECHNICAL ANALYSIS
Prices turned lower as expected,
with prices digesting losses near monthly lows. A daily close below the
11854-78 area (March 2009 high, 14.6% Fibonacci expansion) exposes the
11679-737 region (February 26 low, 38.2% Fib retracement).
S&P 500 TECHNICAL ANALYSIS
Prices declined as expected
after putting in a bearish Evening Star candlestick pattern below
February’s swing high. A daily close belowrising trend line support at
2057.10 exposes the March 12 low at 2040.10.

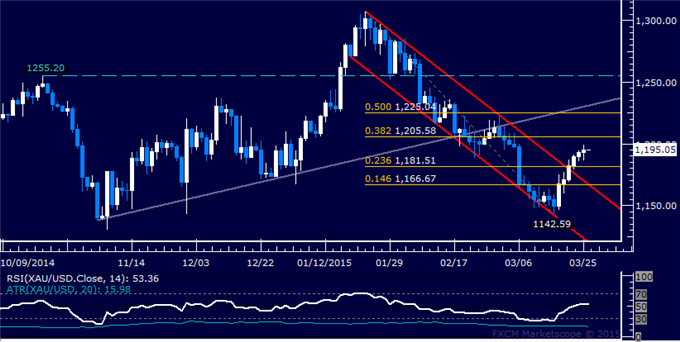
GOLD TECHNICAL ANALYSIS
Prices look poised for another move
above the $1200/oz figure. A break above the 38.2% Fibonacci retracement
at 1205.58 exposes the 50% level at 1225.04. Alternatively, a turn
below the 23.6% Fib at 1181.51 targets the 1166.67-1170.09 area (channel
top resistance-turned-support, 14.6% retracement).
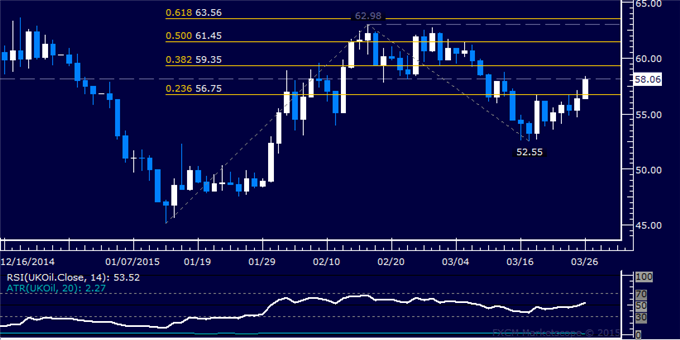
CRUDE OIL TECHNICAL ANALYSIS
Prices are attempting to break
higher out of the consolidation range carved out over the past 2 weeks. A
daily close above support-turned-resistance at 58.17 exposes the 38.2%
Fibonacci expansion at 59.35. Alternatively, a reversal back below the
23.6% level at 56.75 targets the March 17 lowat 52.55.